Cardano price reveals the start of a bullish move that could extend into a nice, explosive rally in the coming days. ADA investors, however, need to exercise caution due to month-end volatility.
Cardano price does not slow down
Cardano price action between November 11 and 25 shows that a trend line can be drawn connecting the four lower highs formed in the same period. On November 26, however, ADA saw a sudden spike in selling pressure, which pushed it above the aforementioned trend line.
After overtaking this blockade, Cardano price is currently grappling with an overhead hurdle at $0.321. Traders need to exercise caution and enter long positions after ADA flips the $0.321 resistance level into a support floor.
In such a case, Cardano price could trigger an 18% upswing to $0.382.
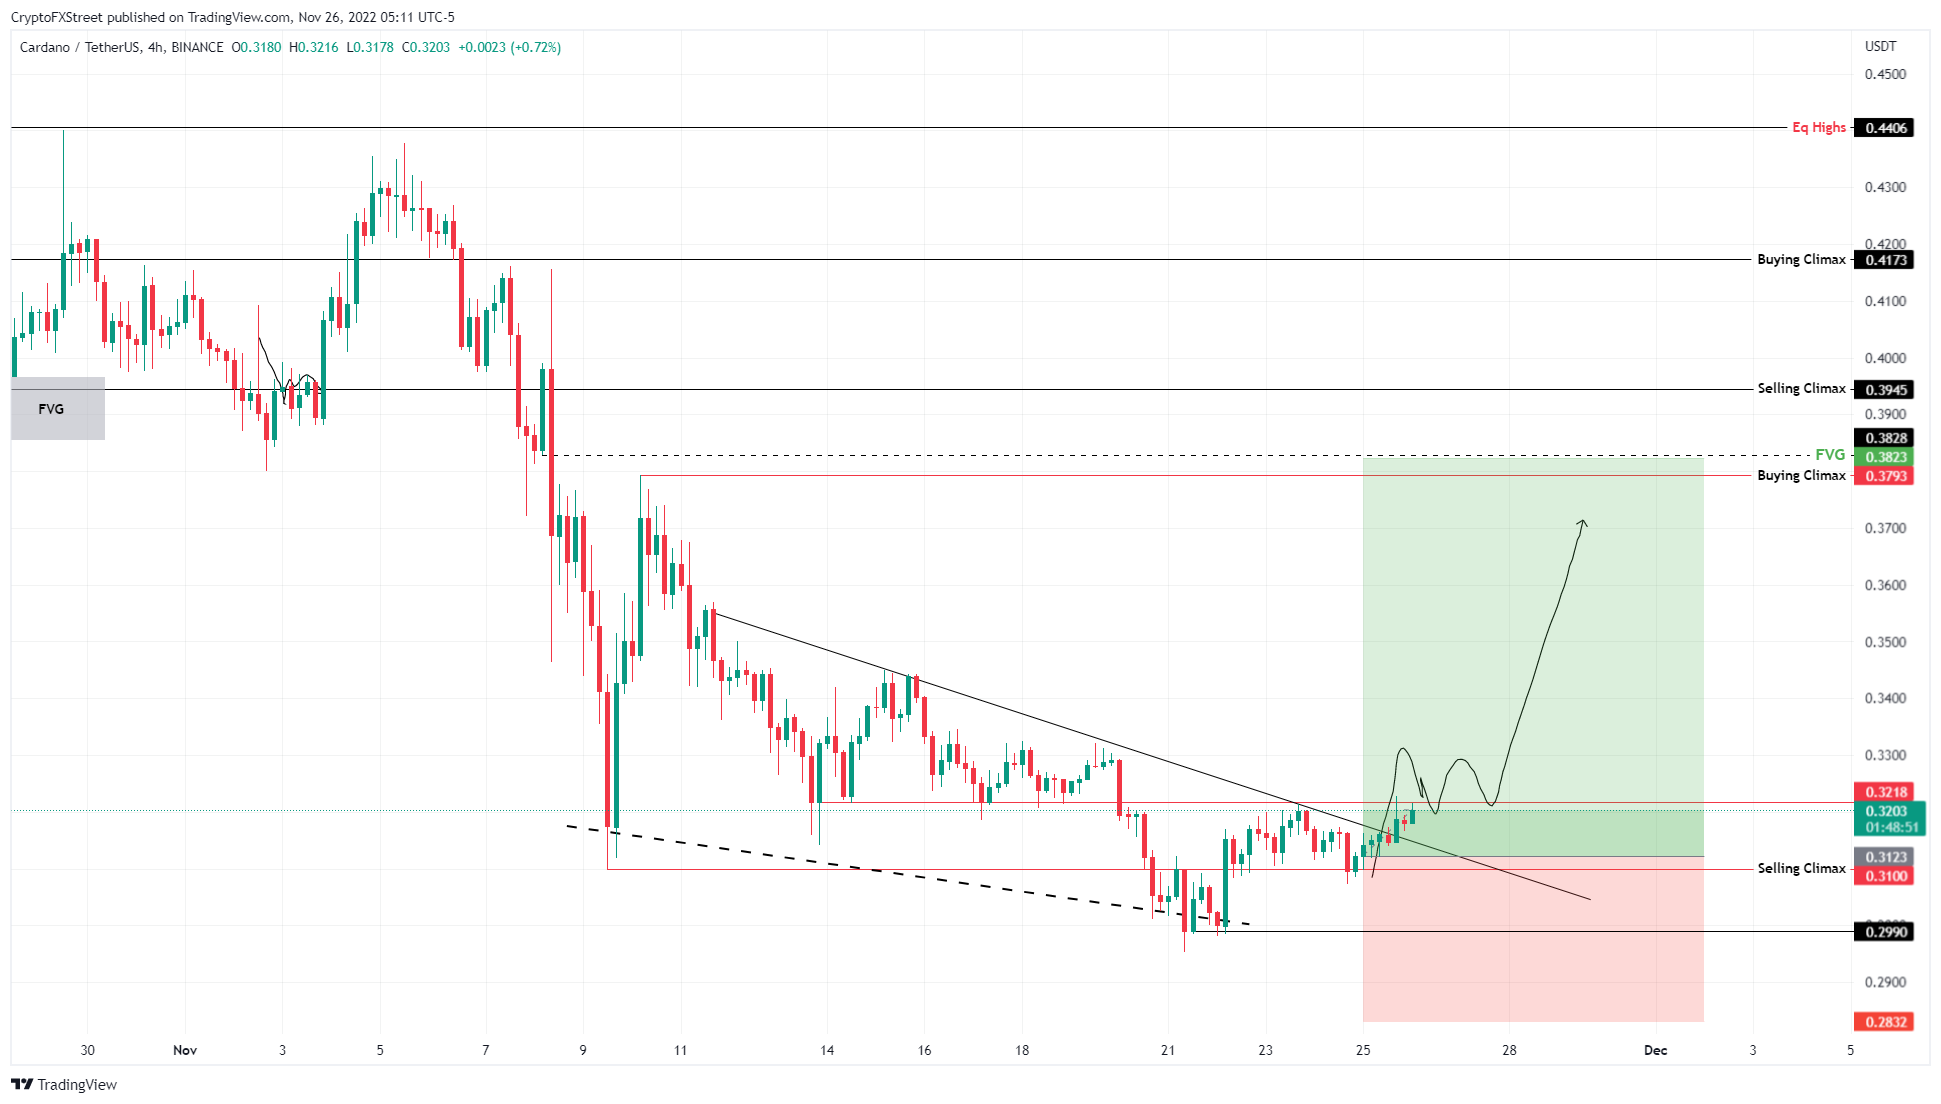
ADA/USDT 4-hour chart
Supporting this bullish move for Cardano price is the 30-day Market Value to Realized Value (MVRV) model hovering around 8% after bouncing from a low of -14%.
This index determines the average profit/loss of investors that purchased ADA over the past month. Based on Santiment’s research, a value between -10% to 25% is ideal for recovery rallies to kickstart.
For the last four months, any declines in this on-chain metric from 11.3% to 28.3% have resulted in a bottom formation. Although past results do not indicate future outcomes, investors need to pay attention to this strategy as it could trigger a run-up.
%20%5B14.57.49,%2026%20Nov,%202022%5D-638050543204140661.png)
ADA 30-day MVRV indicator
While things are looking up for Cardano price, a breakdown of the $0.300 support level will invalidate the bullish thesis. This development will allow ADA to revisit the $0.310 support level.