Cardano (ADA) has broken down from a consolidation pattern that had been in place since May 12. As a result, a new yearly low is expected.
ADA has been falling since reaching an all-time high price of $3.10 on Aug. 2021. The downward movement has followed a descending resistance line and led to a low of $0.40 on May 12, 2022.
Since then, the price has stopped its decrease and has actually bounced slightly. It is currently hovering just above $0.42.
The closest support area is at $0.36. This is an important horizontal level that previously acted as resistance (red icons) in May 2018 and then in Jan 2021 (red icons).
/Related
MORE ARTICLESXCN, SOL, APT, AXS and Sand Are the Crypto Market’s Least Successful Cryptocurrencies
LBank’s 2022: A year of Challenge and Perseverance
Ethereum Merge Checkpoint Reached in 2022; What’s to Come in the New Year?
Bitfarms CEO Steps Down After Selling Shares; Bitcoin Mining Capitulation Spreads
Ripple and CEO Brad Garlinghouse’s Top 5 Crypto Wins of 2022
Investigator Shows How Poor Crypto Exchange KYC Can Empower Criminals
The breakout from the latter was the catalyst for the beginning of the upward movement towards a new all-time high.
Therefore, despite a massive decrease since the all-time high, the price has yet to reach a significant horizontal support level. Additionally, the RSI has yet to break out from its bearish divergence trend line (green).
As a result of these readings, the continuation of the downward movement towards the $0.36 area seems to be the most likely scenario.
ADA/USDT Chart By TradingView
ADA breakdown and wave count suggests downward movement will continue
The daily chart shows that ADA has been trading inside a symmetrical triangle since the aforementioned May 12 low. While the symmetrical triangle is considered a neutral pattern, a breakdown from it is the most likely scenario, since the triangle is happening after a downward movement.
On Oct. 2, the price reached a low of $0.41, in the process breaking down below the low of the D wave (red line). This confirmed the bearish wave count, stating that the price has now broken down from the symmetrical triangle. This scenario is also supported by the preceding RSI breakdown below 50 (red icon).
The 1.61 extension of the height of the triangle suggests that the price will fall towards $0.23.
ADA/USDT Chart By TradingView
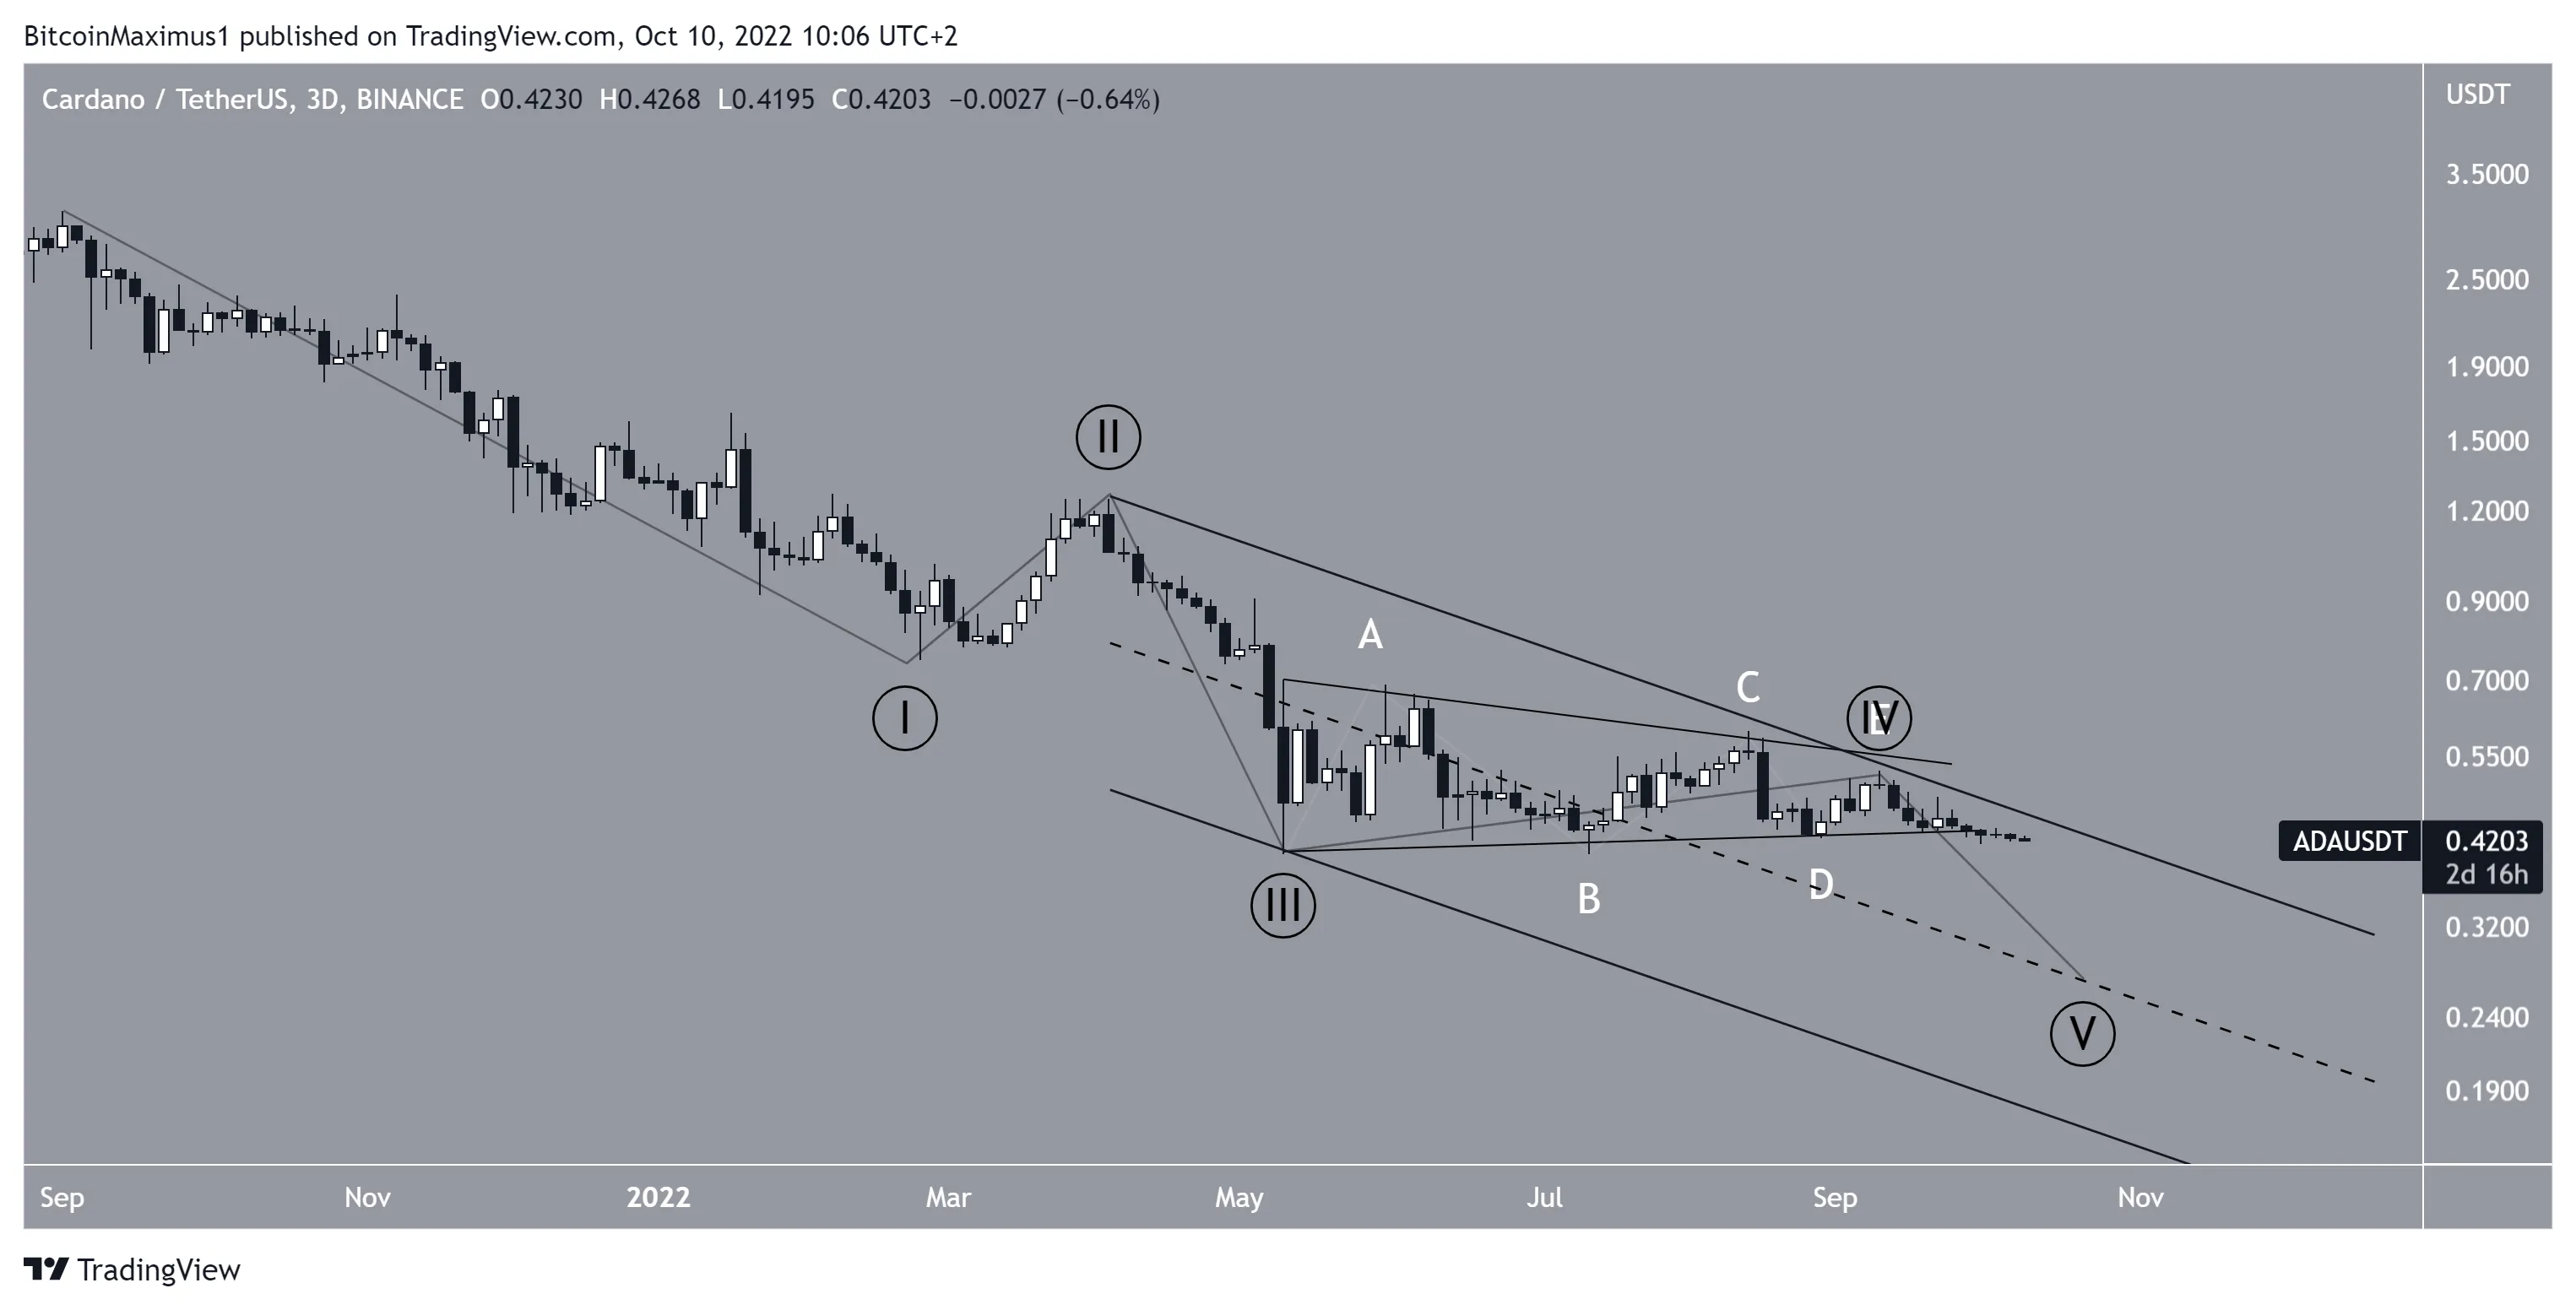
As for the longer-term wave count, it is likely that the triangle was wave four of a five wave downward movement (black). Therefore, the price has now begun wave five.
A low of $0.22 is also given by using a parallel channel to connect the highs of waves two and four. Due to this confluence, it is likely that the price will fall towards these levels.
 ADA/USDT Chart By TradingView
Conclusion
In the case of ADA, all three of the price movement, technical indicator readings and the wave count are bearish. A target of $0.25 is likely due to a confluence of Fib levels and channeling methods.
While this is the most likely scenario, an increase above $0.52 would invalidate it.


