Cardano (ADA) has created a higher low and is in the process of moving towards the resistance line of its horizontal range.
ADA had been decreasing underneath a descending resistance line since reaching an all-time high price of $3.10 in Aug. 2021. This downward movement led to a low of $0.40 in May next year.
Despite this low, the price still managed to break out from the descending resistance line. In the period between May – July 2022, the weekly RSI generated a significant bullish divergence (green line). Afterward, the RSI broke out from a descending resistance line that had been in place since March 2021. So, when combined with the divergence, this indicates that a bullish reversal has begun.
/Related
MORE ARTICLES
FTX: How to Prevent a Similar Dumpster Fire

FTX Japan Will Begin Customer Refunds In February 2023

Pi Network (PI) Listing Sparks Controversy as Price Skyrockets

Stablecoins Dominate the Trading Volume in the Last Crypto Friday of 2022
This Week in Crypto: SBF Gets Bail, Solana Dumpster Fire Continues and Could BNB Be a Security?
AI Chatbots Could Become the Future of the Metaverse
If so, the closest horizontal resistance area is at $1.10, while the closest Fib resistance (0.382) is at $1.44.
ADA/USDT Chart By TradingView
Current ADA range
The daily chart shows that since May’s bottom, the price has been trading inside a horizontal range with support and resistance at $0.46 and $0.645, respectively.
An interesting level is found at $0.544. The level has intermittently acted as both resistance (red icons) and support (green icons) since the end of May. As long as the price is trading above it, an upward movement towards the resistance line would be the most likely scenario.
Furthermore, the daily RSI is above 50 and increasing, supporting the possibility for an upward movement.
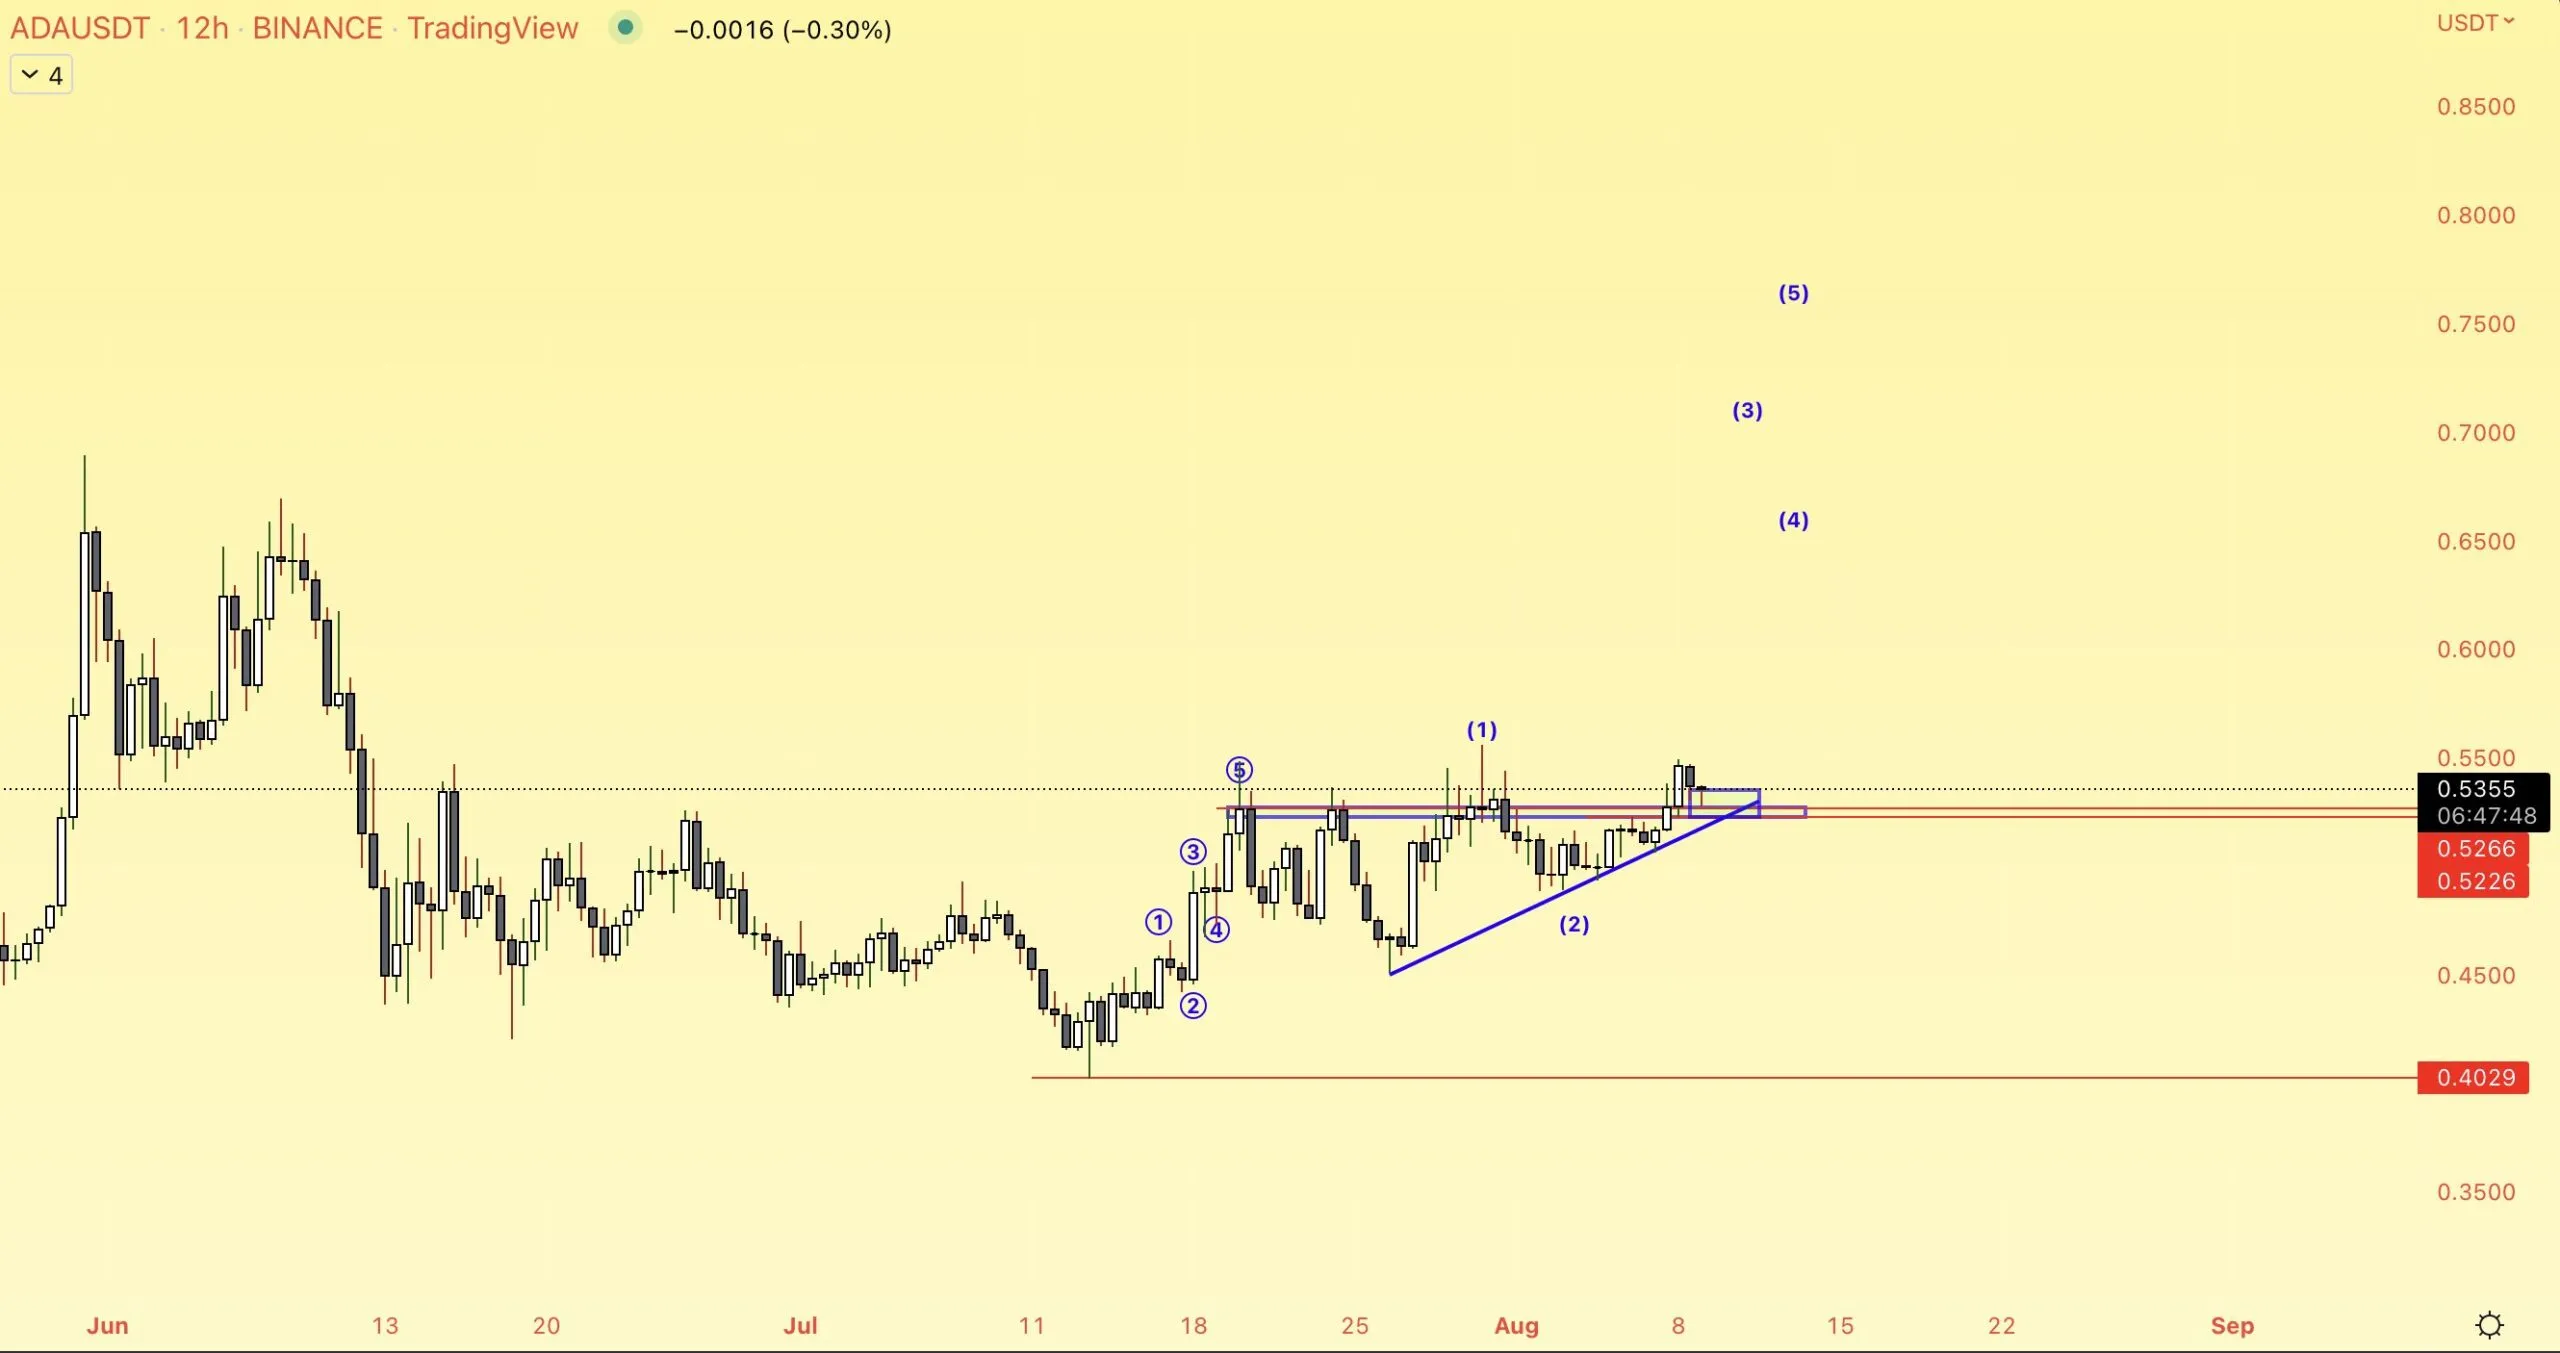
Wave count analysis
Cryptocurrency trader @Altstreebet tweeted a chart of ADA, stating that the price has begun a new upward movement.
 Source: Twitter
Measuring from the July 13 low, the most likely count suggests that ADA has begun a five-wave upward movement (black). If so, it is currently in wave three and sub-wave three (yellow). Therefore, if the count is correct, the rate of increase would be expected to accelerate in the near future.