Cardano (ADA) has been falling inside a corrective pattern since reaching an all-time high in Sept. There are no bullish reversal signs in place yet.
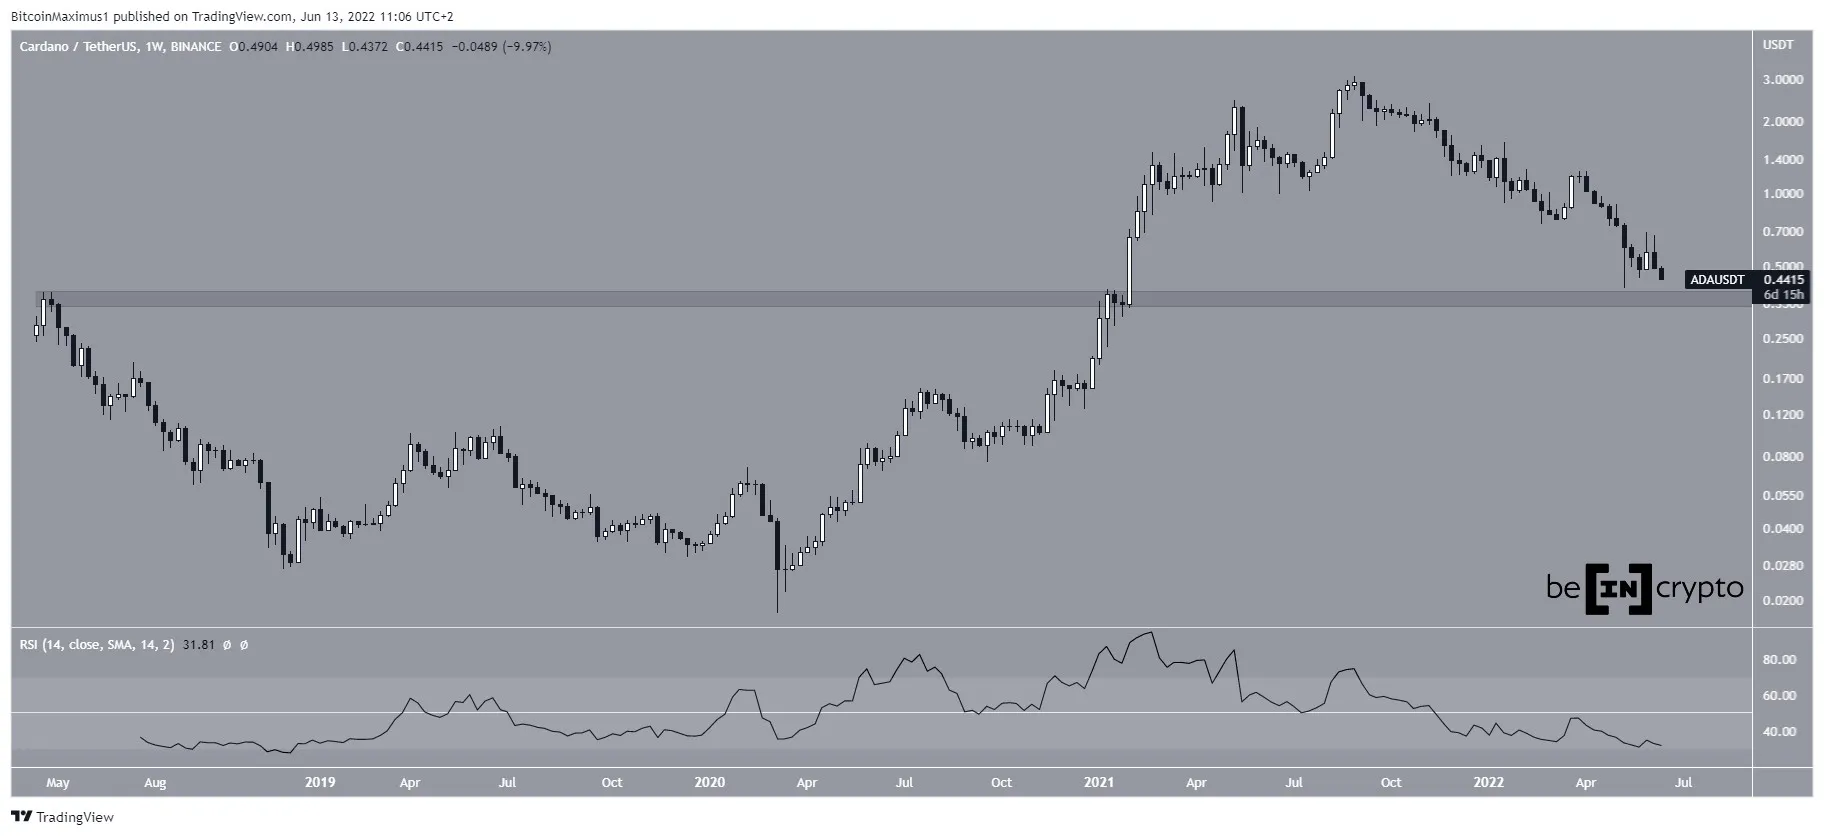
ADA has been falling since reaching an all-time high price of $3.10 on Sept 2. The downward movement has been swift and so far led to a low of $0.40 on May 12.
While the price has bounced slightly since, there are no clear bullish reversal signs in place. To the contrary, the weekly RSI is falling and is below 50.
/Related
MORE ARTICLES
FTX: How to Prevent a Similar Dumpster Fire

FTX Japan Will Begin Customer Refunds In February 2023

Pi Network (PI) Listing Sparks Controversy as Price Skyrockets
Stablecoins Dominate the Trading Volume in the Last Crypto Friday of 2022
This Week in Crypto: SBF Gets Bail, Solana Dumpster Fire Continues and Could BNB Be a Security?
AI Chatbots Could Become the Future of the Metaverse
If the downward movement continues, the closest support area would be at $0.36. This is an important horizontal support level since it acted as resistance in May 2018 and then as support in Nov 2020.
 ADA/USDT Chart By TradingView
Cryptocurrency trader @Pentosh1 tweeted an ADA chart which shows a 85% drop since the all-time high. At the current price of $0.45, the price has decreased by exactly 85%.
Decrease inside channel
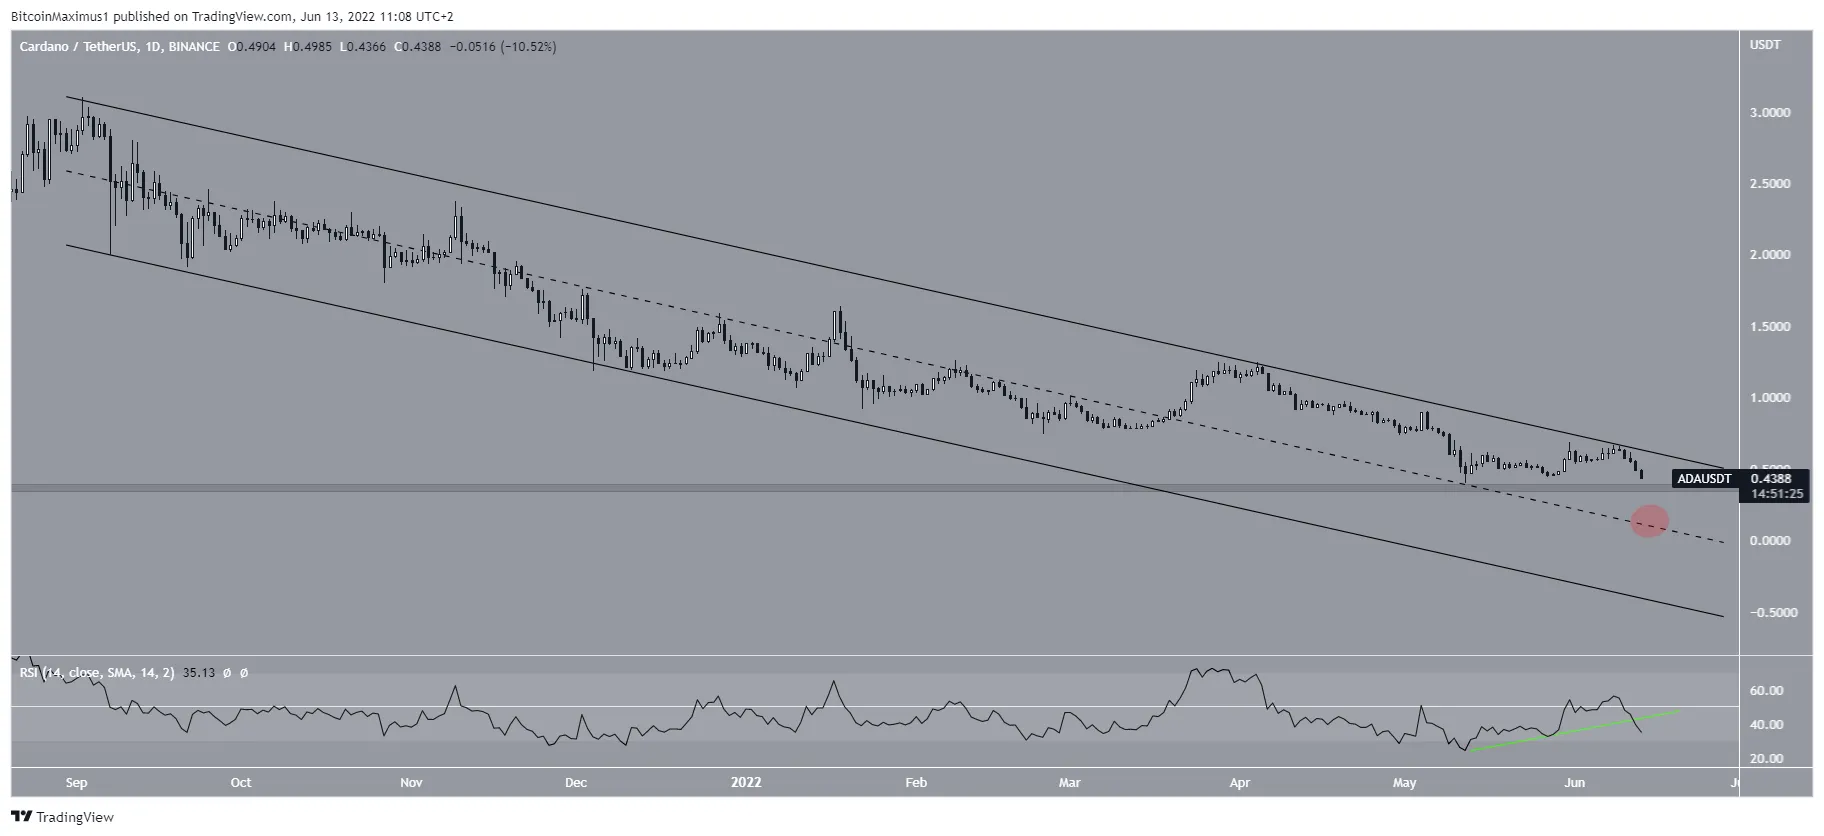
The daily chart shows that ADA has been decreasing inside a descending parallel channel since the aforementioned all-time high.
While such channels usually contain corrective movements, meaning that a breakout from the would be likely, the price was rejected by the resistance line of the channel on June 9. In turn, it has been falling since.
Furthermore, the daily RSI has broken down from its ascending support line (green line).
If the $0.36 area fails to provide support, the next closest support level would be at $0.15, created by the middle of the channel (red circle).
 ADA/USDT Chart By TradingView
ADA breaks down
Finally, the six-hour chart shows that ADA has already broken down from an ascending parallel channel. This supports the possibility that the downward movement will continue.
Besides the double bottom support at $0.40, using an external Fib retracement on the most recent upward movement provides targets of $0.33 and $0.23. The former also coincides with the long-term support level, increasing its significance in the process.


