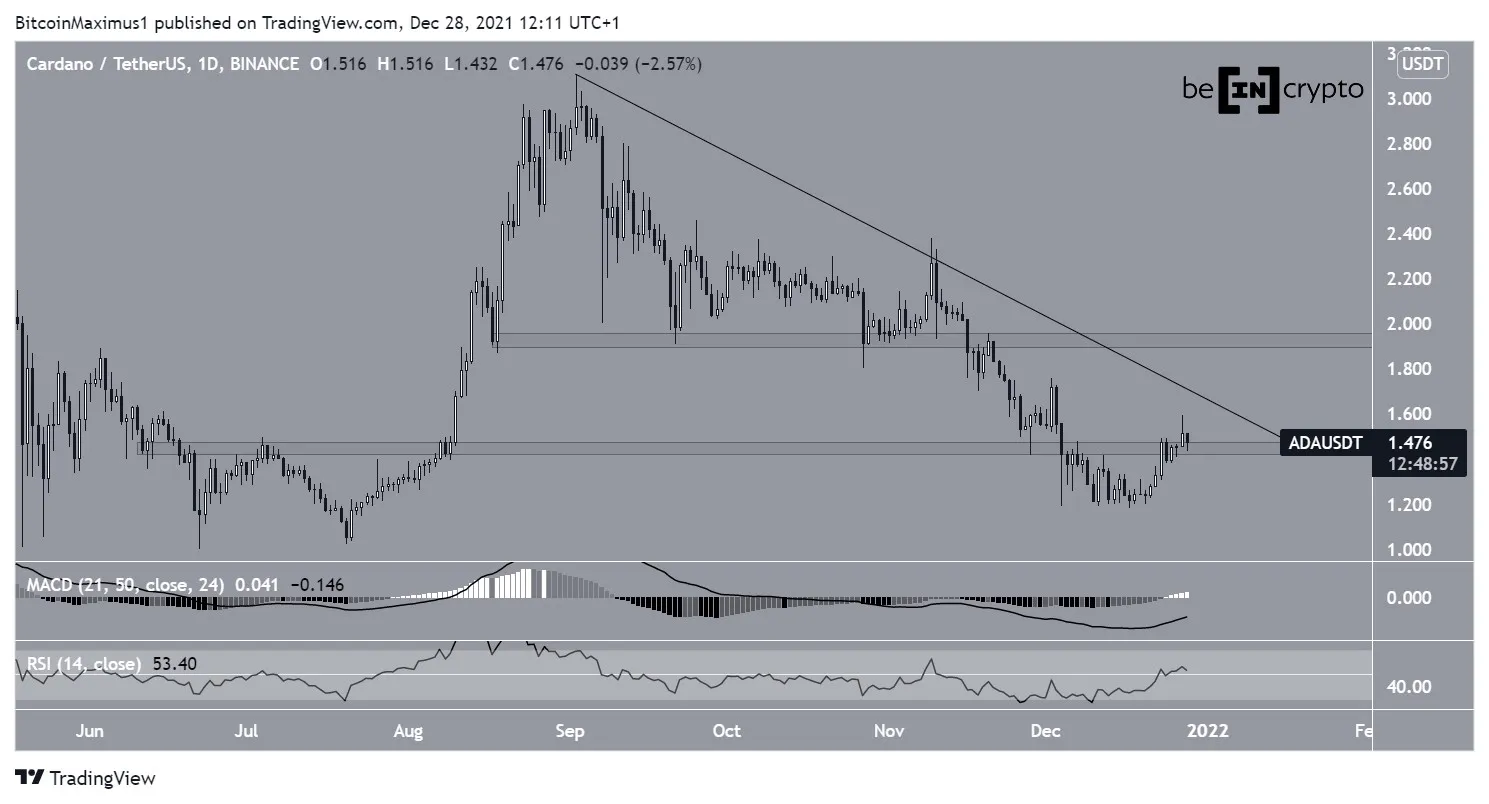
Cardano (ADA) has broken out from a short-term descending resistance line and would confirm a bullish reversal with a breakout from the longer-term line.
ADA has been decreasing alongside a descending resistance line since reaching an all-time high price of $3.1 on Sept 2. The downward movement continued until Dec 4, when the token reached a low of $1.18.
Afterwards, it initiated an upward movement and reclaimed the $1.45 horizontal area, which had previously acted as support.
Technical indicators are bullish.
The MACD, which is created by a short- and a long-term moving average (MA), is moving upwards and is nearly positive. This means that the short-term MA is faster than the long-term one and is a sign of bullish trends.
The RSI, which is a momentum indicator, has crossed above the 50 line. Movements above this line are also considered signs of a bullish trend.
However, until ADA manages to break out from the descending resistance line, the trend cannot be considered bullish.
If a breakout transpires, the closest resistance area would be at $1.95.
 Chart By TradingView
Short-term movement
The six-hour chart shows that ADA has already broken out from a descending resistance line, one that had been in place since Nov 8.
The $1.95 area is strengthened when looking at this time-frame, since besides being a horizontal resistance area, it is also the 0.618 Fib retracement resistance level.
Therefore, a breakout above it would be a major bullish development.
ADA wave count
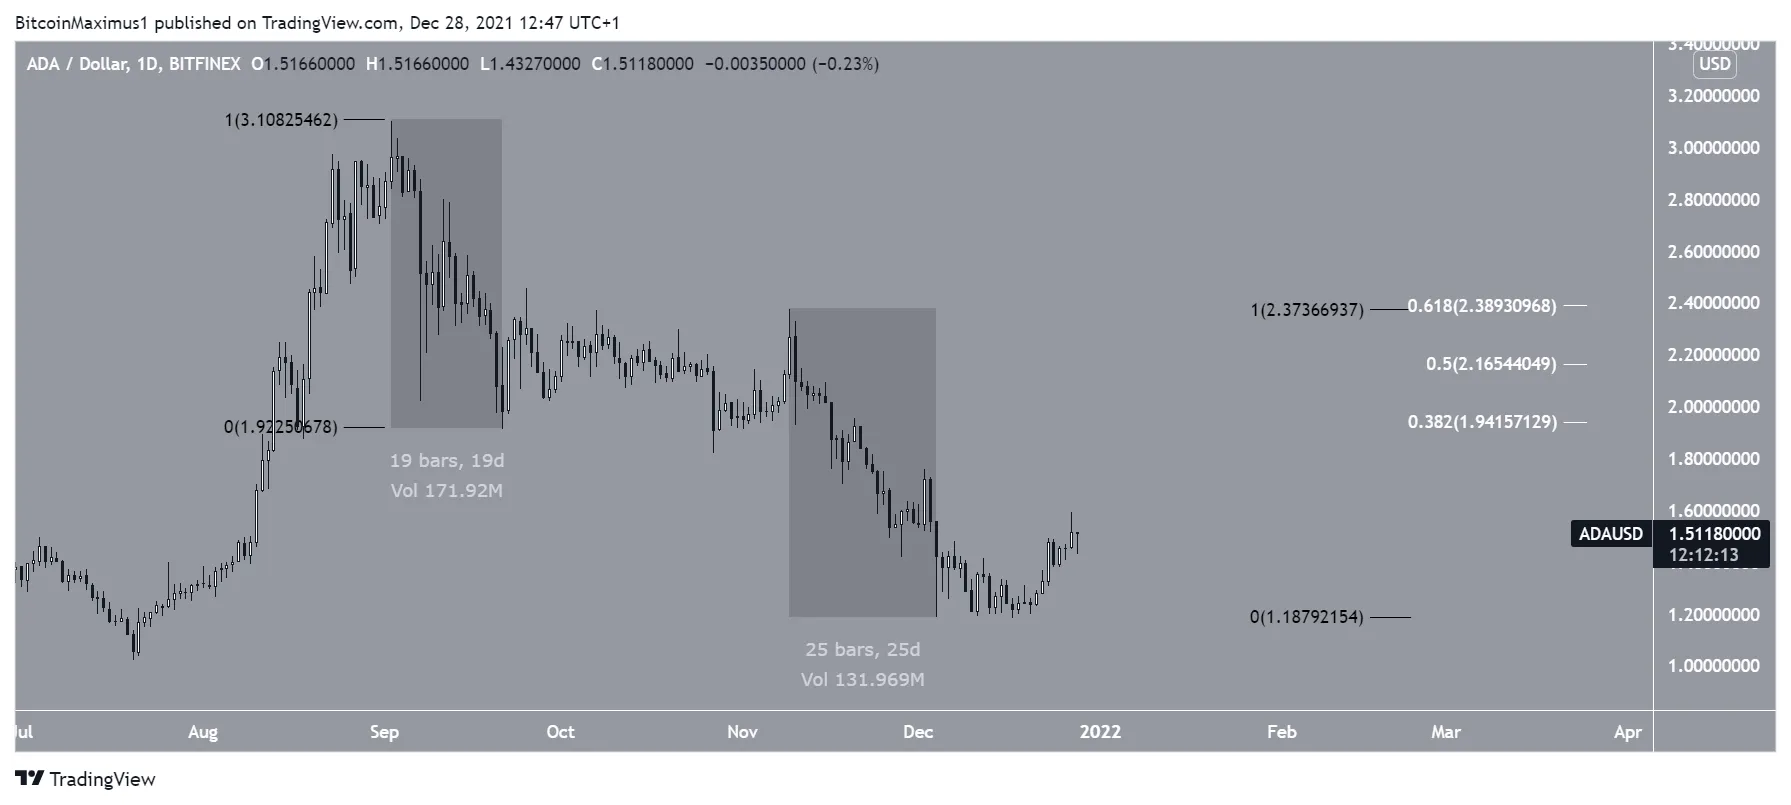
Cryptocurrency trader @TheTradingHubb outlined an ADA chart, stating that the token has completed its correction and will now bounce.
Both parts of the downward movement (highlighted) had a 1:1 ratio, meaning that they were equal in length. Therefore, it is likely that the correction is complete.
The first potential resistance area is at $1.94, the 0.382 Fib retracement support level (white). However, it would be more likely for ADA to increase towards either the 0.5 or the 0.618 Fib retracement resistance levels. The area found at $2.16 and $2.38, respectively.
 Chart By TradingView


