Tezos (XTZ)
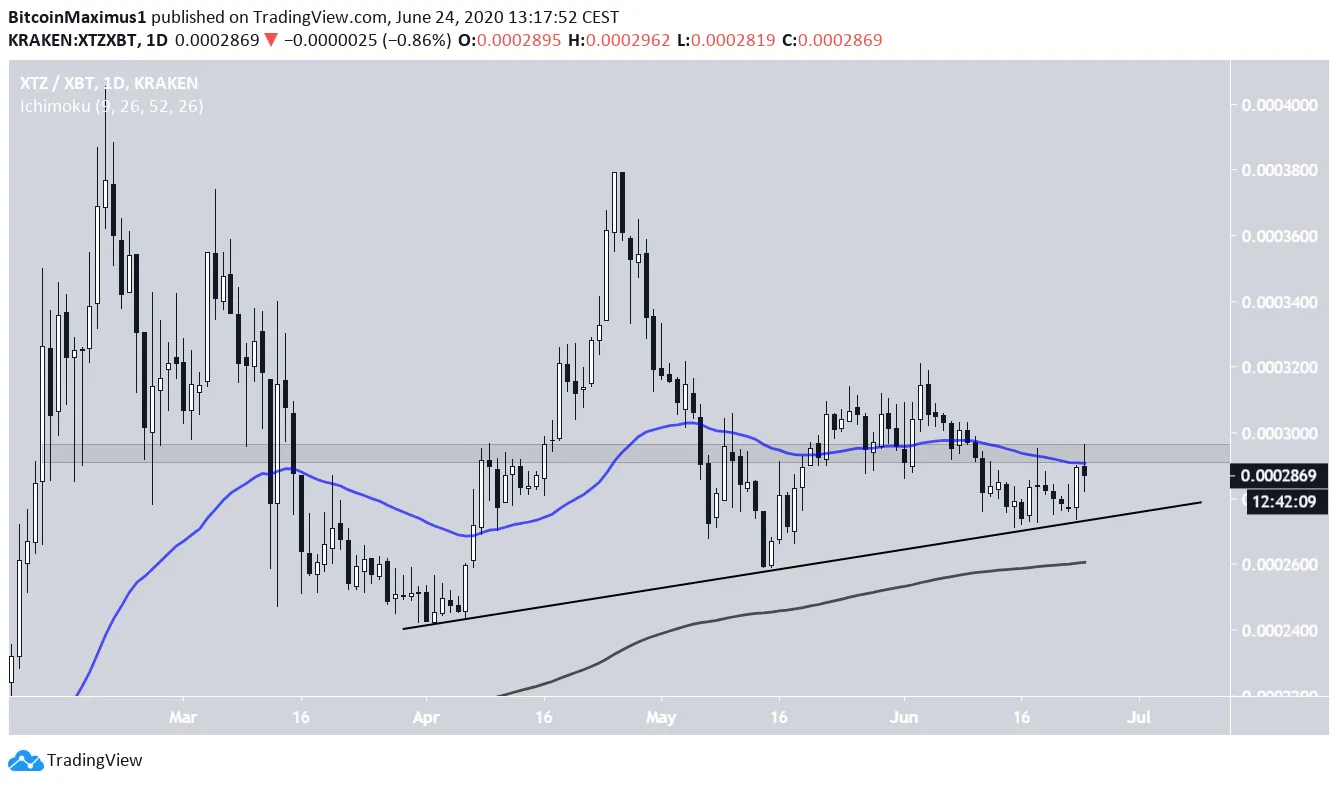
The XTZ price has been increasing alongside a rising support line since the beginning of April. It is currently bouncing above it for the third time. The support line is also strengthened by the presence of the 200-day moving average (MA), which is only slightly below this line. However, the price is facing strong resistance from the 50-day MA and the 29,500 satoshi resistance area, which previously acted as support. Until the price is able to successfully flip this area as support, the move cannot be considered bullish.
 XTZ Chart By Tradingview
In the shorter-term, XTZ has broken out from a descending resistance line, and the RSI is holding well above 50. This is a sign that the XTZ price will continue moving upwards and break through the resistance area previously outlined.
Cryptocurrency trader @RookieXBT explains that the majors are likely to move upwards. Highlighting Cardano (ADA) and Tezos (XTZ), he said:
Anyone else feel that majors are on the brink of getting absolutely sent? Namely $ADA and $XTZ
Since we’ve determined that XTZ looks bullish, let’s take a closer look at ADA next.
Cardano (ADA)
The ADA price has been increasing since January 14. However, the rate of increase accelerated sharply at the end of May, along with the volume. The price reached a high of 947 satoshis on June 4 and has been declining slightly since. The next important resistance levels are found at 985 and 1170 satoshis, the 0.382 and 0.5 Fib levels of the entire downward move. The price should reach at least one of these areas since the price action remains bullish. This is particularly evident in the long lower wick of June 19. The candle validated the previous resistance area and immediately bounced upwards.
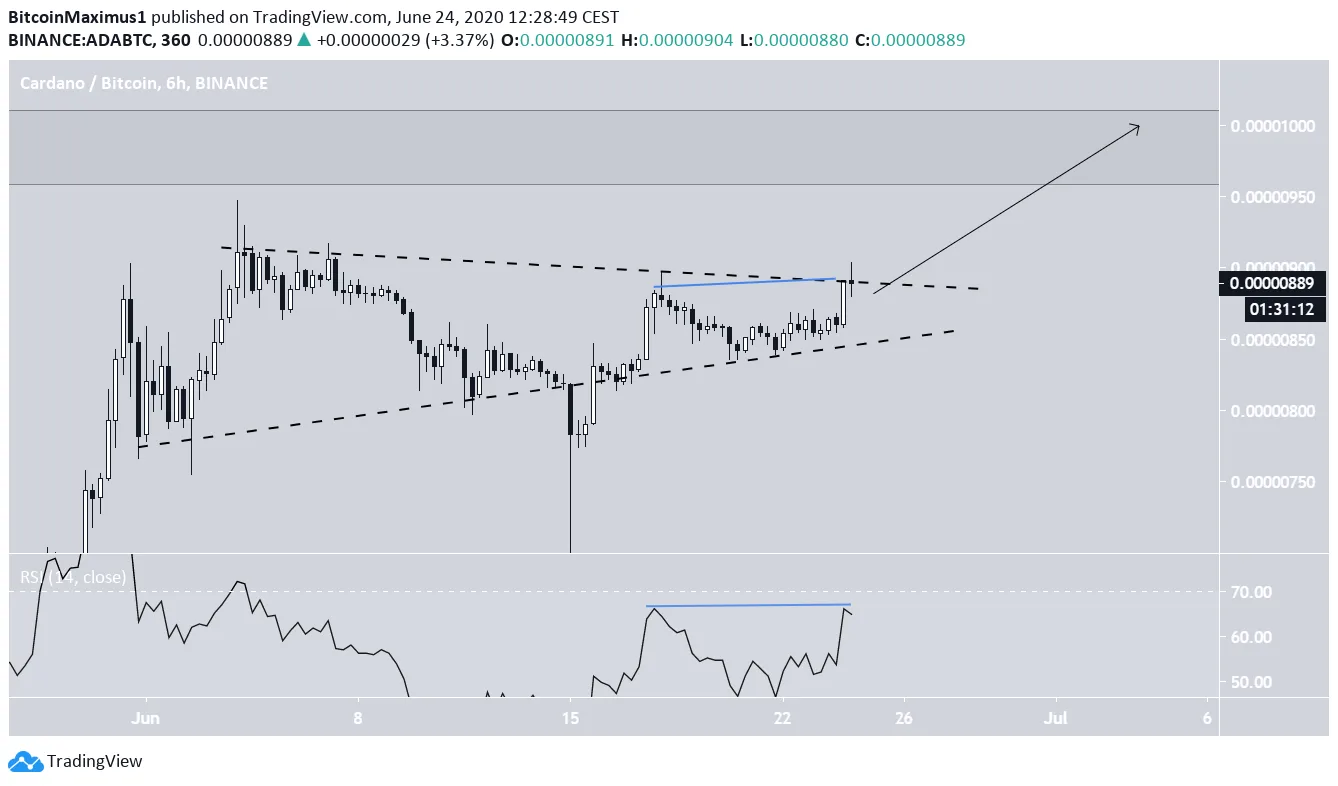
In the shorter-term, ADA is trading inside a symmetrical triangle, with the exception of the aforementioned wick which went way below the rising support line. Even though the triangle is considered a neutral pattern, the fact that it is taking place after an upward move makes a breakout more likely. The scenario is further strengthened by the fact that there was no bearish divergence during the recent highs.
 ADA Chart By Tradingview


