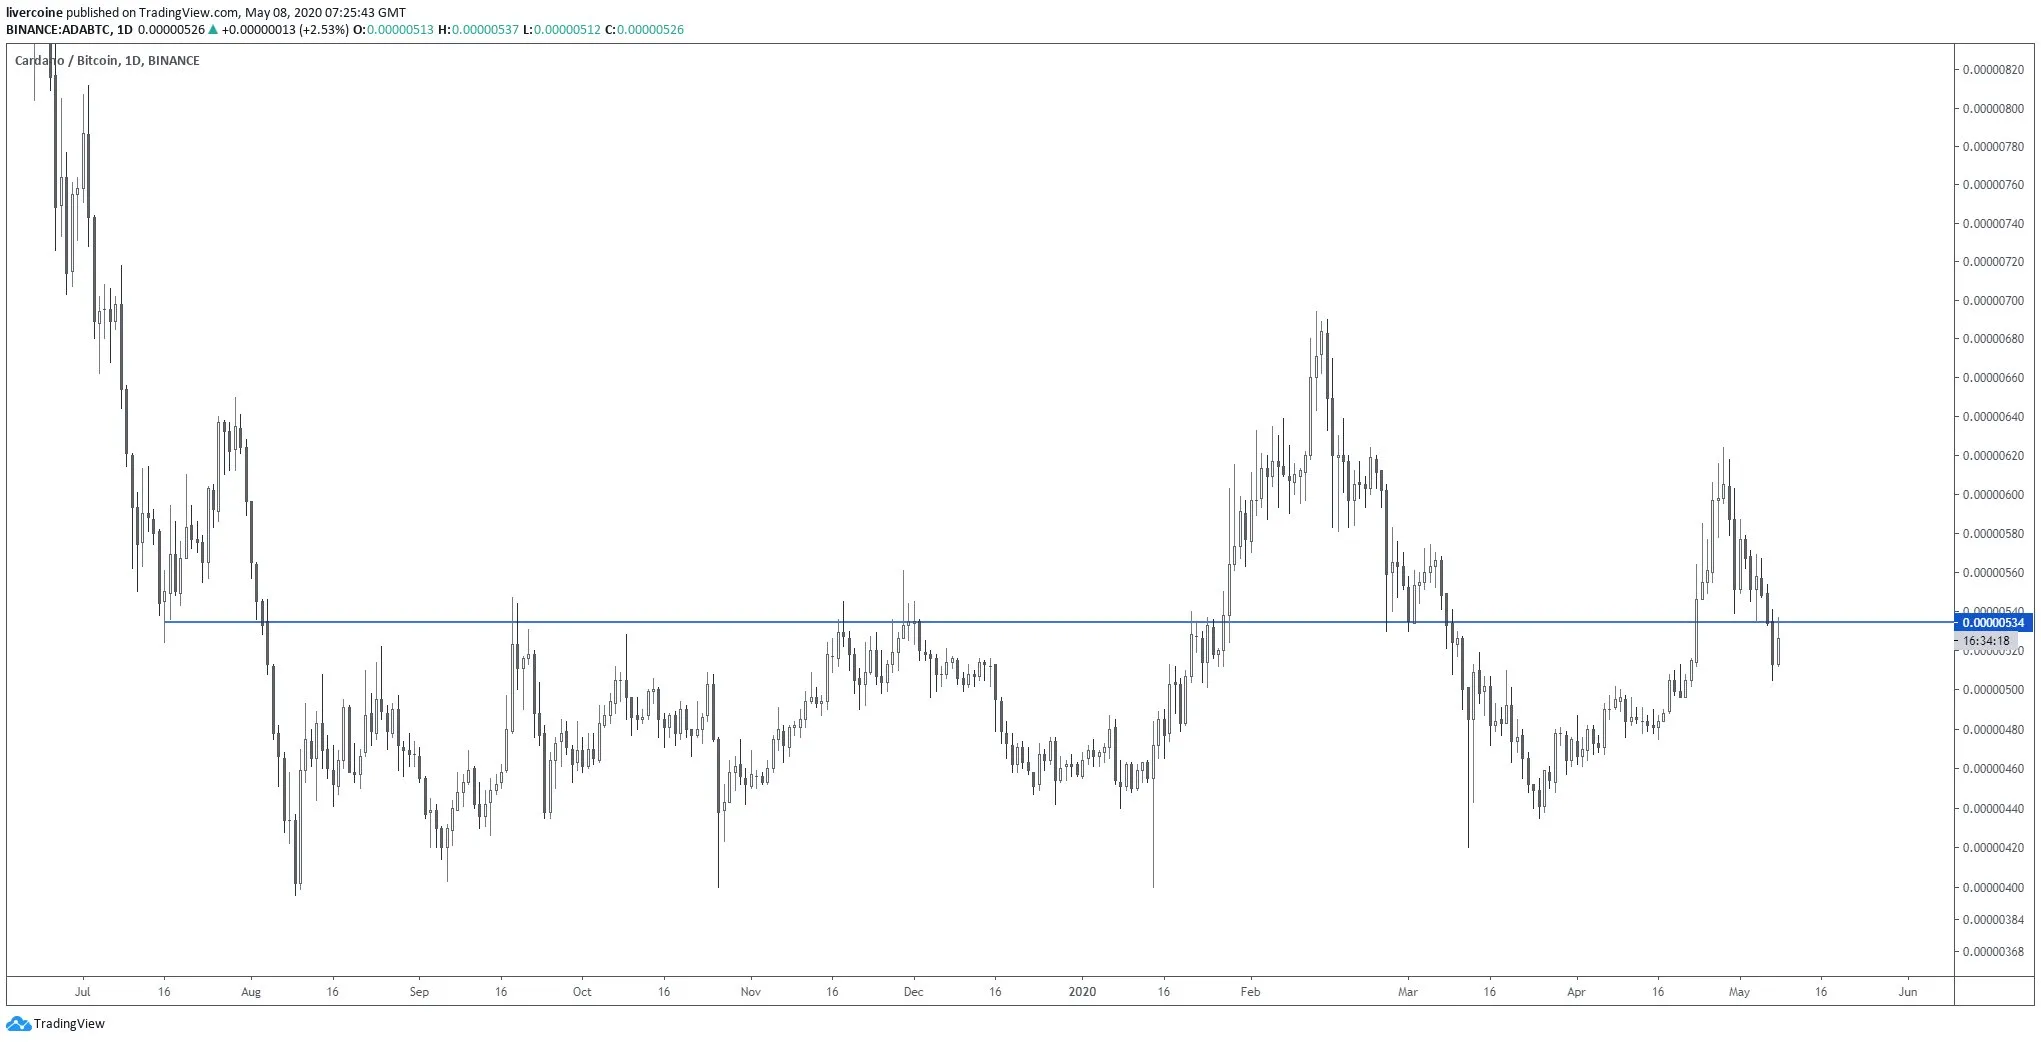
However, yesterday’s increase caused the price to lose an important support level. Cryptocurrency trader @livercoin tweeted an image that shows the price of ADA having fallen below a crucial support area.
 Source: Twitter
He stated,
Last chance to short the next plunge… $ADA
In this article, we will take a closer look at the ADA price movement and determine where it is heading to next.
ADA/BTC
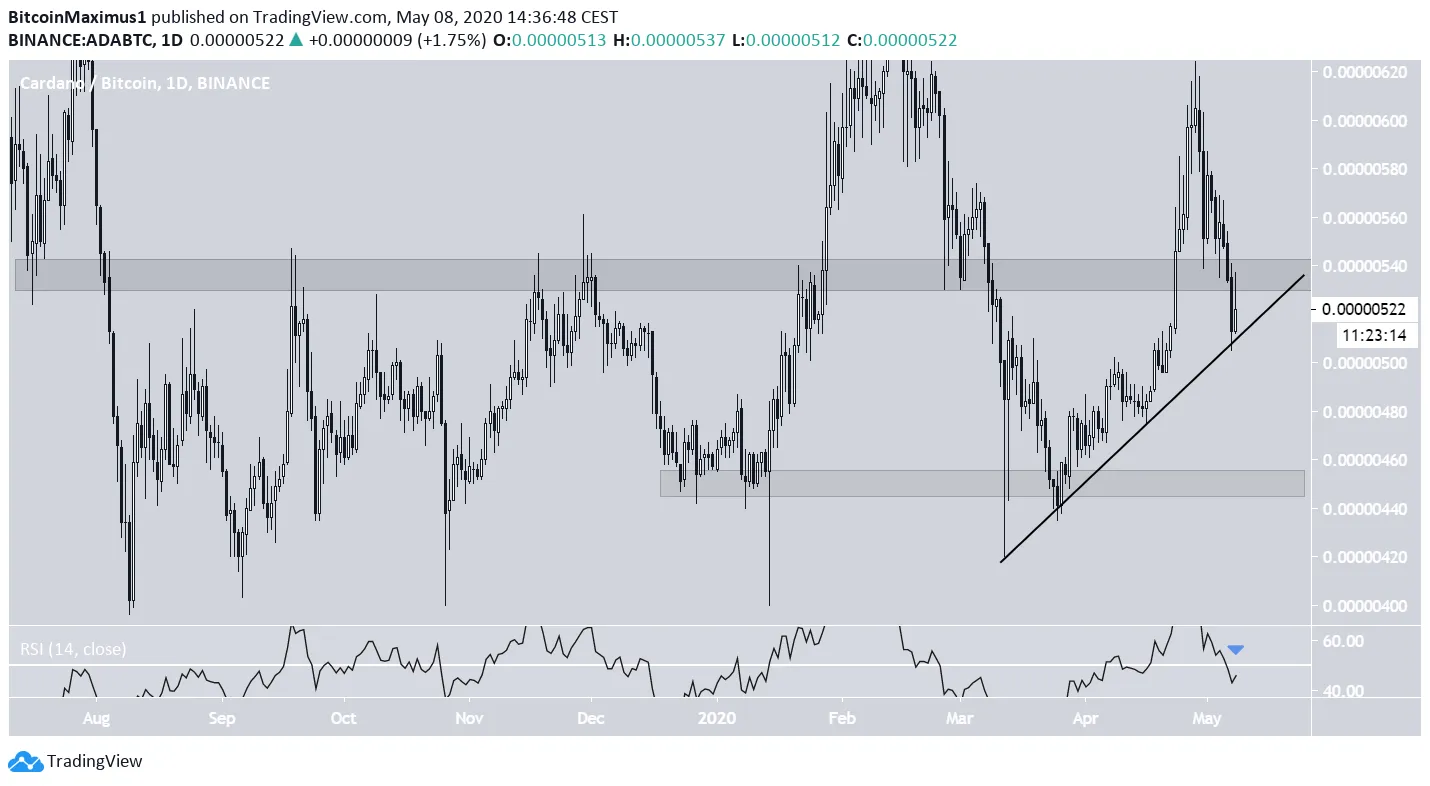
The ADA price has just fallen below an important support area, which is found at 540 satoshis. This movement was also combined by a daily RSI decrease below 50, a sign that the trend is turning bearish. Since August 2019, this area has been the main determinant of ADA’s trend. When the price has been above this level, its trend has been bullish and vice versa. However, despite the recent decrease, ADA is still trading above the ascending support line that has been in place since March 12. As long as it is trading above this line, it is expected to increase at the rate predicted by its slope. However, a breakdown from the line would take the price towards the closest support level, found at 450 satoshis.
 ADA Chart By Trading View
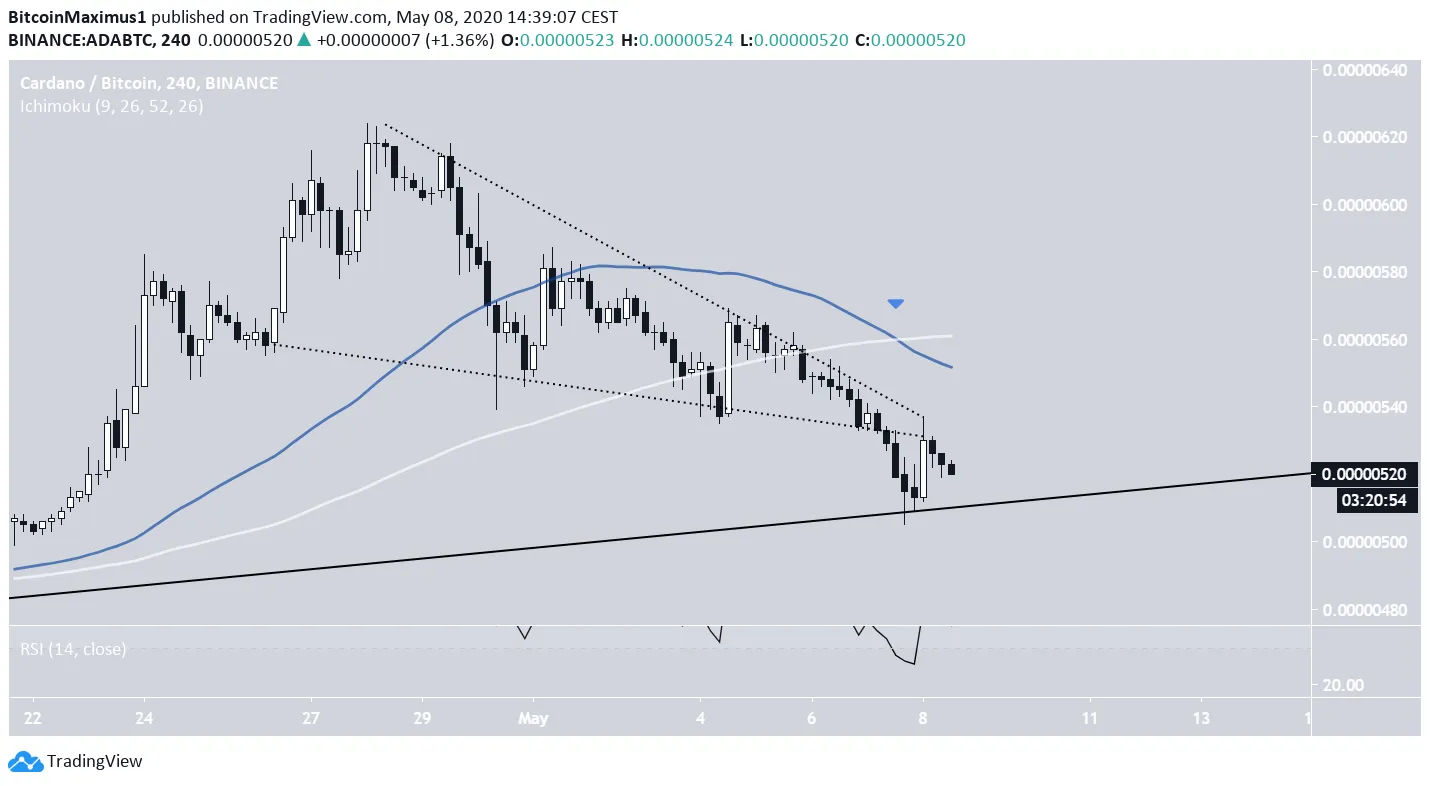
However, the short-term outlook is bearish. The price has broken down from a descending wedge, even though the wedge is considered a bullish reversal pattern. We have a bearish cross transpiring between the 50- and 100-period moving averages (MA), along with numerous bearish crosses on lower time-frames. In addition, while the RSI is oversold, it has not generated any trace of bullish divergence. Therefore, while the price could bounce at the current ascending support line, it is more likely to break down eventually, heading towards the 450 satoshi support.
 ADA Chart By Trading View
ADA/USD
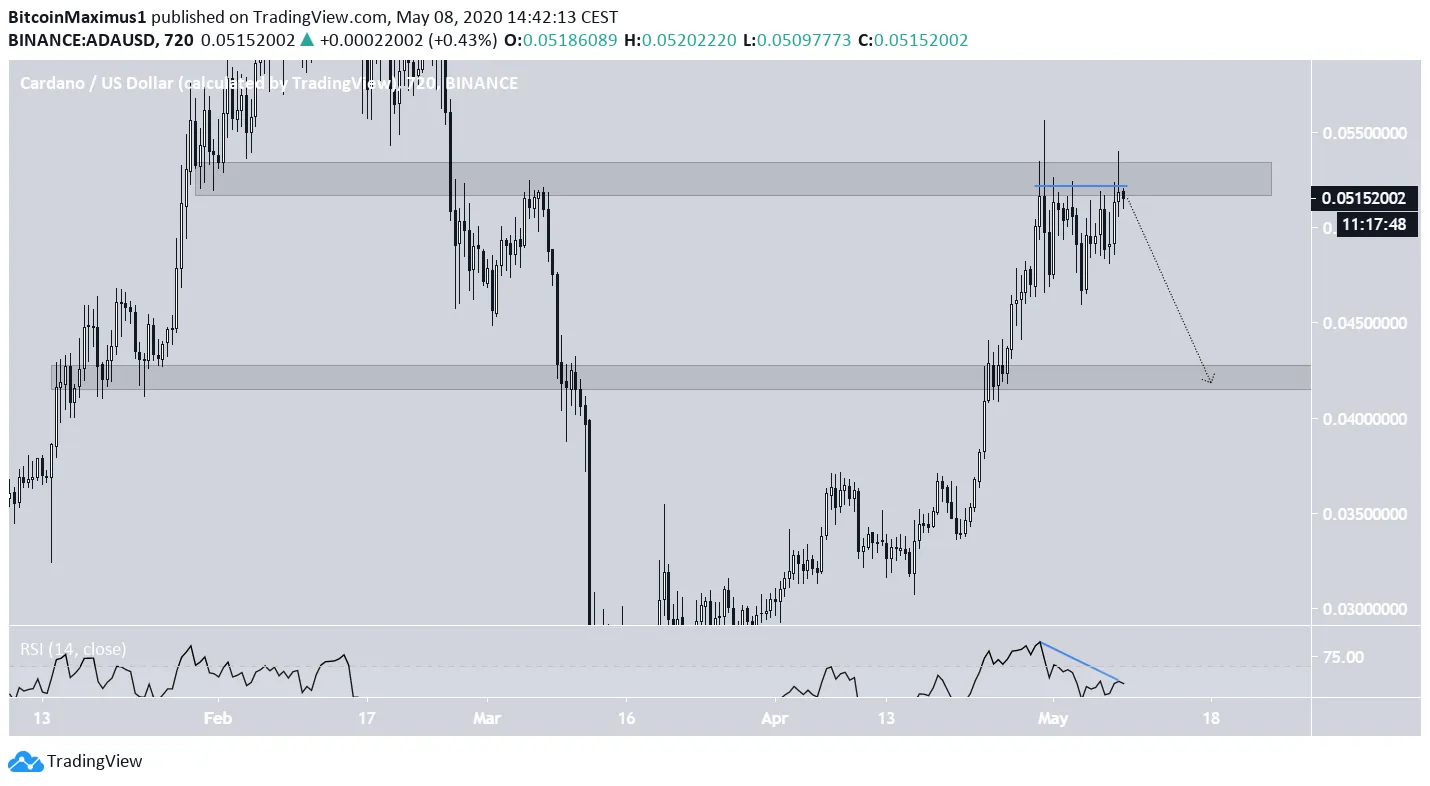
The ADA/USD pair has been increasing since March 13. However, on April 30 it reached a high of $0.553 before decreasing sharply. It has yet to revisit these highs. At the time of writing, it was trading inside the $0.052 resistance area, having created a double top which is combined with bearish divergence in the RSI. This suggests that the price is likely to decrease towards the closest support area, found at $0.042.
 ADA Chart By Trading View
To conclude, the ADA/BTC pair is barely holding on to its last point of support. On the other hand, while ADA/USD is in a relatively long-term upward trend, it is showing clear signs of weakness in the form of a bearish reversal pattern and bearish divergence in the RSI.


