This COTI price prediction takes COTI’s utility, fundamentals, tokenomics, trading popularity, on-chain parameters, and price charts into account. COTI stands for Currency of the Internet. The protocol aims to become a decentralized payment setup that supports low-cost transactions. It caters to merchants and consumers alike, helping crypto make strides as a medium of exchange. It even offers the framework for other decentralization-specific Fintech products to build on top of it. And it leads all that with DAG (Directed Acyclic Graph) DLT technology, which is far more scalable than the standard blockchain.
The all-encompassing narrative regarding decentralized finance is what makes COTI and its native token such a desirable long-term option. Now let us read through this COTI price prediction to understand how it looks as a prospect.
#BonusHunter 💹 We pick the best deals on the market for you: enjoy your bonuses. Maximize your ROI
🔥Bybit – buy COTI, participate in Bybit 4th anniversary: receive a guaranteed bonus of $5 in BIT and get a chance to win BMW X5 or one of iPhone 14 Pro| Sign up and claim your reward here
In this price prediction:
- COTI price prediction: the role of fundamentals
- COTI price action and tokenomics
- COTI trading volume and market cap
- COTI price prediction based on on-chain metrics
- COTI social sentiments and price forecast
- COTI price prediction using technical analysis
- COTI price prediction 2023
- COTI price prediction 2025
- COTI price prediction 2030
- How accurate is the COTI price prediction?
- Frequently asked questions
COTI price prediction: the role of fundamentals
COTI is a layer-1 protocol for enterprises and users driven by the COTI treasury. The protocol came into existence in 2017, built atop the Ethereum blockchain. In 2019, it transitioned to its own mainnet. As such, it is now a coin rather than a token.
Here are the fundamental factors you need to know about COTI:
- Supports transactions at 10,000 TPS.
- Boasts the effective PoT or proof-of-trust consensus.
- It aims to focus on payments and being a financial ecosystem.
- COTI coins support staking.
- Has Cardano Foundation as a celebrated investor.
- COTI is the official issuer of the Cardano-powered stablecoin Djed.
- The COTI coin has a native blockchain. It is also compatible with ERC-20 and the Binance Smart Chain standards.
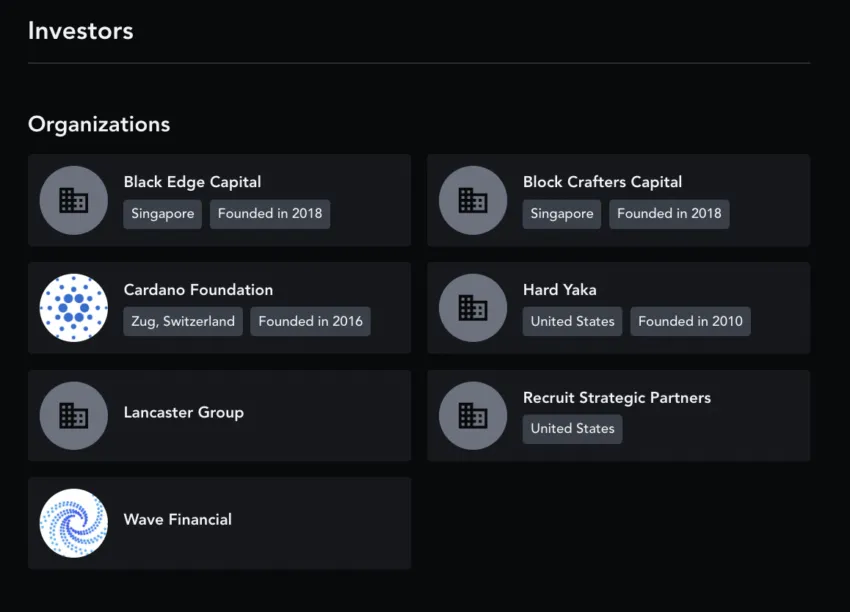 COTI investors: Messari
COTI has some exciting developments and prospects in the works. And Cardano’s stablecoin, if executed properly, could ramp up future price action.
Investors might get exciting insights in January 2023, as that is when Djed — the stablecoin — is expected to launch.
COTI price action and tokenomics
COTI has a fixed supply of 2 billion coins. As of Dec. 11, 2022, 55% of those coins are in circulation.
Here is what the initial supply spread looked like. The project and founders only held 25% starting out, which is a good sign for the price action.
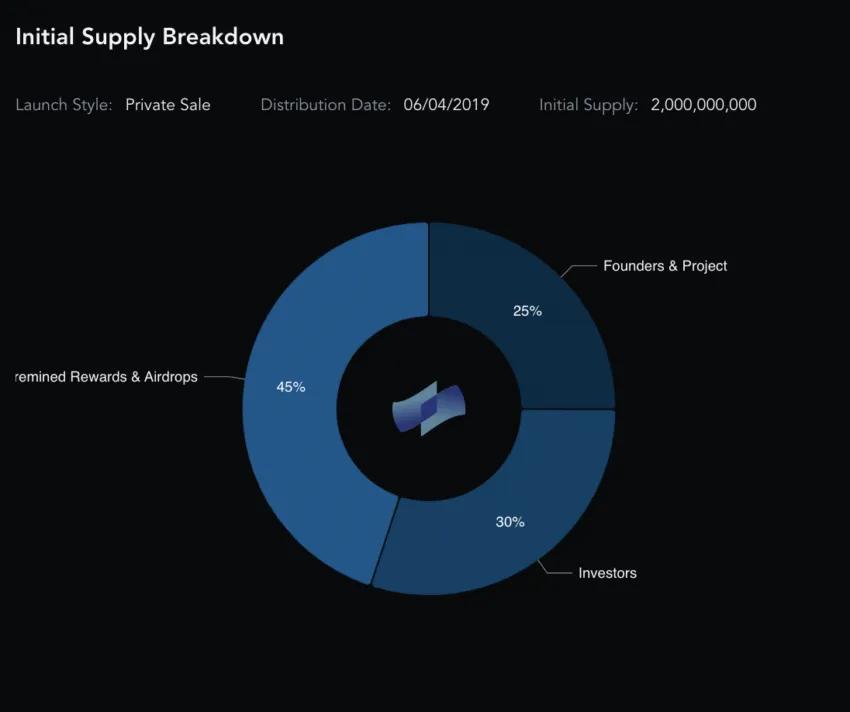 COTI supply: Messari
Also, as it’s a fixed-supply coin, scarcity will kick in once the total supply equals the circulating supply. However, that holds only if COTI is still in demand. Supply saturation should come by 2027.
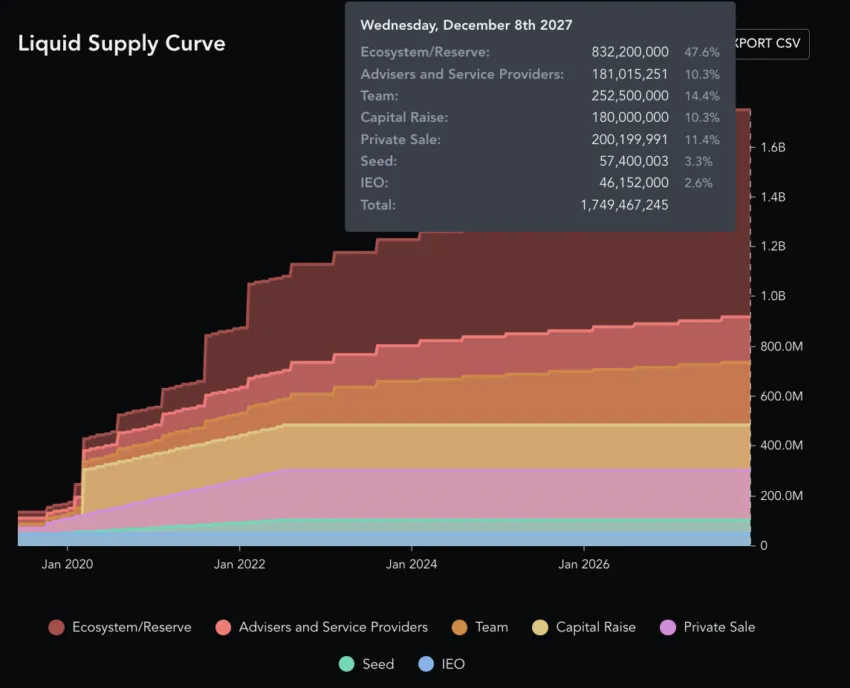 COTI liquid supply breakdown: Messari
COTI trading volume and market cap
How is COTI is faring in terms of volatility compared to when the market cap was its highest? Let’s take a look.
COTI’s market cap was the highest on Nov. 1, 2021:
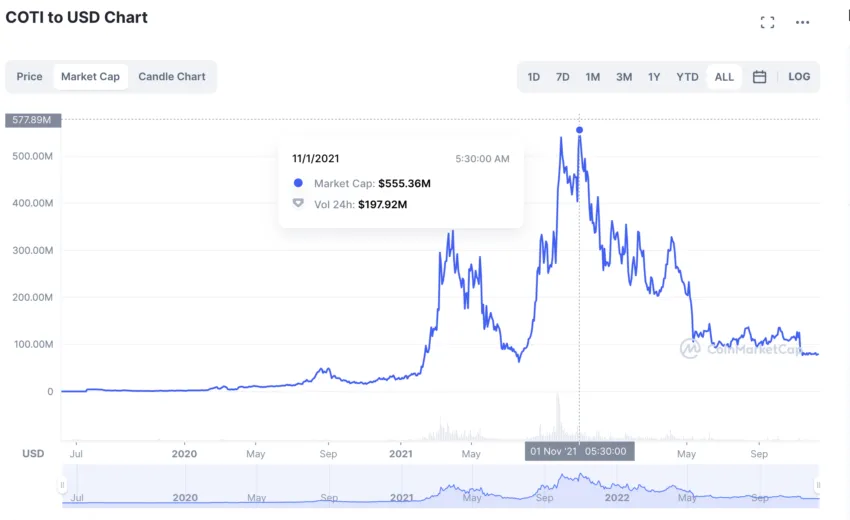 COTI price prediction using market cap: CoinMarketCap
Market cap: $555.36 million
Trading volume: $197.92 million
The turnover ratio of trading volume/market cap: 0.35
COTI’s current market cap and trading volume as of Dec. 11, 2022:
Market cap: $79.44 million
Trading volume: $3.21 million
The turn-over ratio of trading volume/market cap: 0.04
Hence, COTI is more volatile at this moment. A higher turnover ratio means less volatility. Therefore, the price action in the near term might consolidate a little.
COTI price prediction based on on-chain metrics
From June to December 2022, COTI’s development activity has been flat, barring a peak in mid-September.
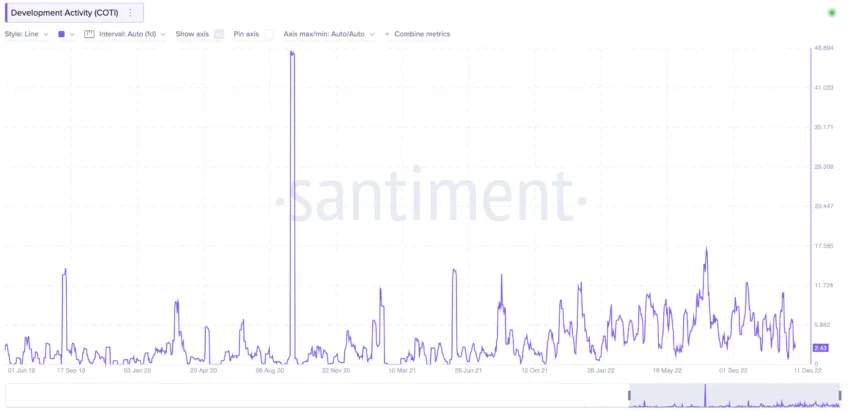 COTI price prediction using developer activity: Santiment
A small rally followed, showing that COTI’s price action does react positively to developer activity.
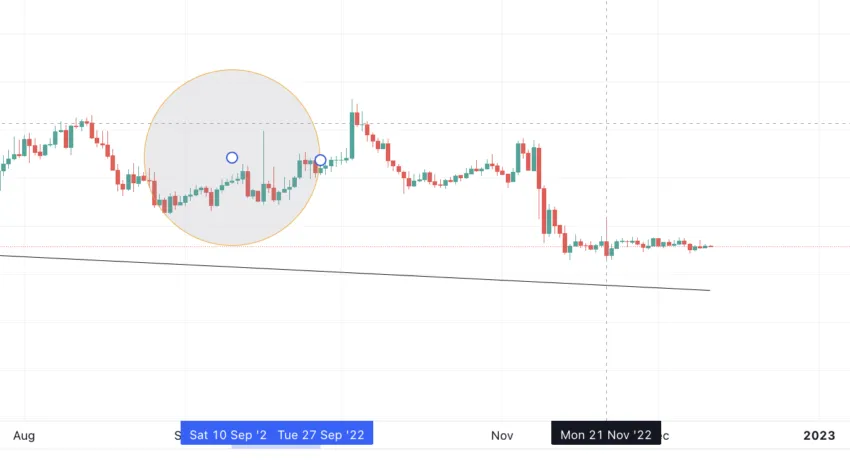 COTI prices in a channel: TradingView
The COTI-USDT pair on Binance is the most prominent. If we look at the funding rate, it has been visibly low since April 2022. The negative funding rate shows traders are betting on COTI prices to go down. This might not be the best indicator.
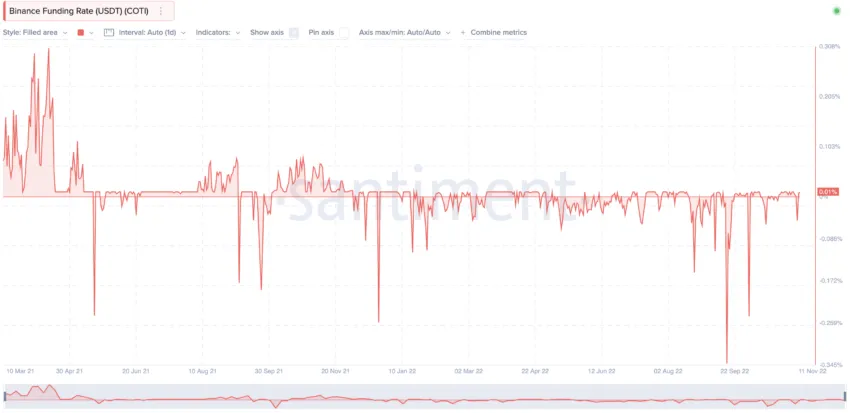 COTI price prediction using funding rates: Santiment
On-chain metrics aren’t looking promising. For the price action to show strength in this market, COTI requires more innovation and even some form of breaking news.
COTI social sentiments and price forecast
Social volume has been low for COTI in 2022. Nothing major is going on, it seems.
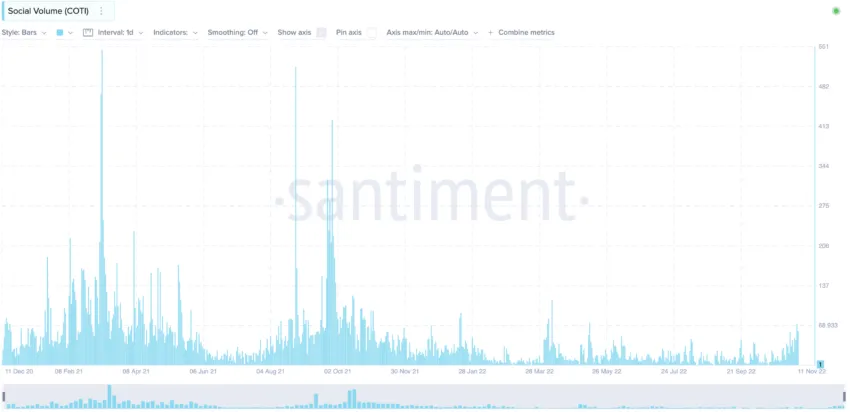 COTI price prediction using social volume: Santiment
Twitter followers have been dropping for the past three months, along with prices.
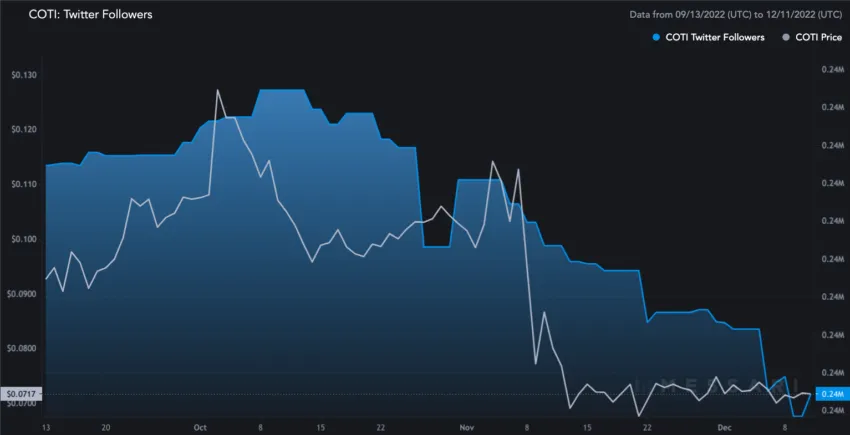 Twitter follower growth: Messari
The social mentions chart shows an overall uptick of 5.3% in the past three months. Also, some social activity was detected close to Nov. 21, 2022, when Cardano made the stablecoin-specific announcement. However, there was no positive impact on COTI coin prices.
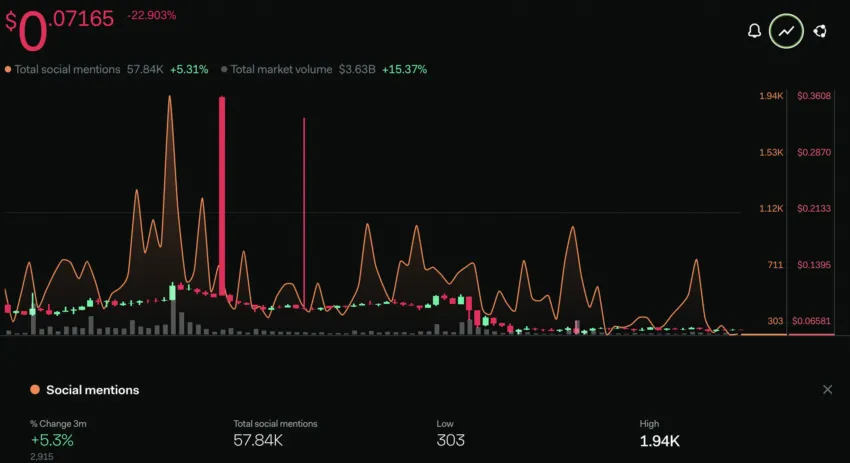 Social growth and COTI prices: LunarCrush
Social activity hasn’t picked up yet. Even with positive signs, the corresponding price action was mostly unresponsive.
COTI price prediction using technical analysis
Now let’s shift our attention to COTI’s technical analysis. We will take a closer look at the price action in this segment to prepare a practical COTI price prediction model.
Here are the things we must know beforehand:
- The all-time high price of COTI is $0.6821.
- COTI reached this milestone on October 31, 2021
- COTI is currently trading at an 89.46% discount to its all-time high.
The weekly chart for mid-term COTI price prediction
Outlook: Bullish
If we look at the daily chart, a clear pattern surfaces:
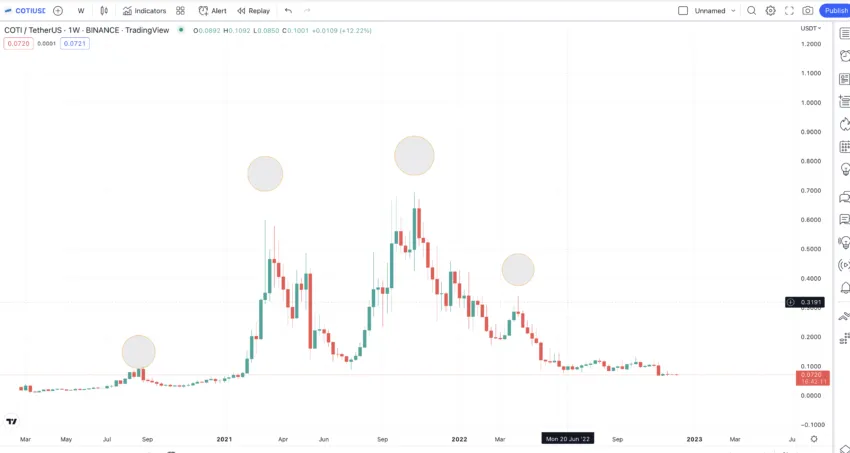 COTI price prediction using weekly pattern: TradingView
Once listed, COTI makes a high from the listed level. It then goes on to make another high and then peaks. This is followed by a lower high.
Let us mark the pattern as A, B, C (the peak), B1, and so on. So, we are looking for the next A1 on this chart.
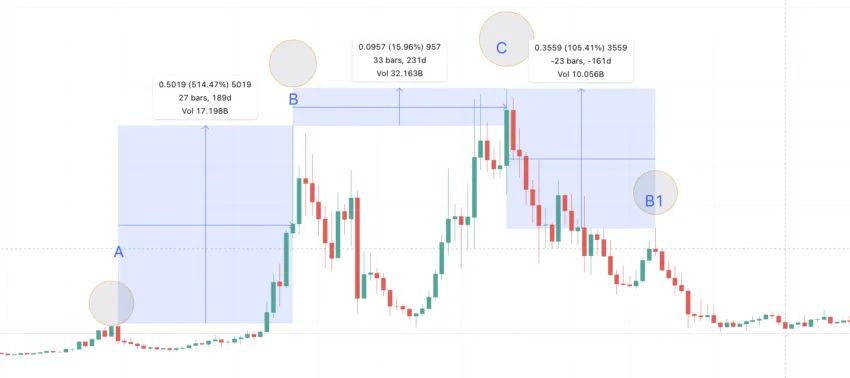 COTI price prediction using the distance between highs: TradingView
Now let us track the distance between A to B, B to C, and then C to B1 to extrapolate a path from B1 to A1.
A to B = 189 days and a 514.57% growth; B to C = 231 days and a 15.96% growth; B 1 to C = 161 days and a 105.41% growth.
COTI price prediction 2023
Outlook: Bullish
Calculations for the next high
COTI took 420 days from A to C and a 602.19% growth rate. Therefore, the next point, A1, regardless of the point where it is created, should be reached within 420 days (approximately) from C. Also, point C should be 602.19% high than A1 to fulfill the pattern.
Now point C is at $0.6821 or COTI’s all-time high. And if the point A1 is X, then X = (0.6821 x 100)/ 702.19 = 0.0971.
Hence, the next high for COTI would be at $0.0971, 420 days from C. Now we can extrapolate and see where A1 lands.
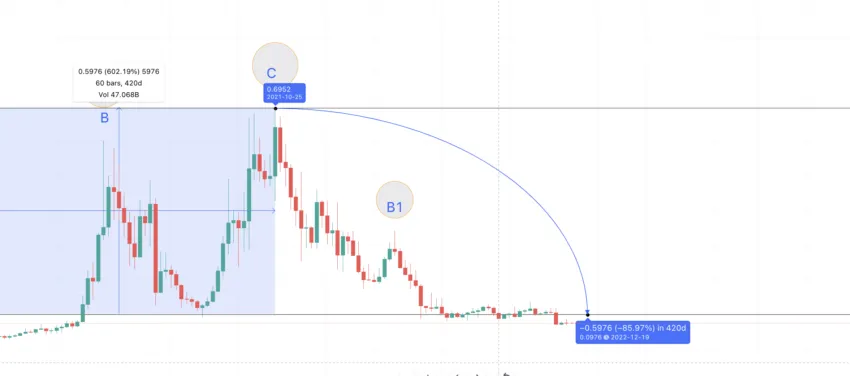 COTI price prediction 2023: TradingView
This comes out as a COTI price prediction for 2022, as the weekly chart suggests that COTI reaches $0.0971 on Dec.19, 2022. That way, the pattern of A-B-C-B1-A1 will be complete.
Now, as A to B takes 189 days with a 514.57% growth, the next high, or B2, should be around June 26, 2023, at $0.5995.
Here is the plotted graph with pointers:
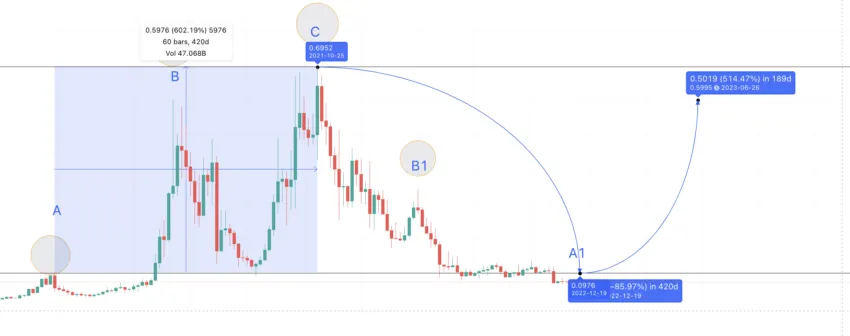 Key COTI price levels: TradingView
Calculating the next low
Now, to find the low for 2023, we can find the distance between B and X (the immediate low). This will help us find the next low after the high of B2 is formed.
So from B to X, it took COTI 133 days and an 85.13% drop.
However, COTI has very strong support at $0.2906. Therefore, after reaching a high in B2, it might not drop to 85.13% after 133 days. Instead, after 133 days, it might settle at 0.2906 (X1) — thereby breaking the pattern and defying the previous low. This would see a drop of a mere 50.96%, with COTI settling at $0.2940 by Nov. 6, 2023.
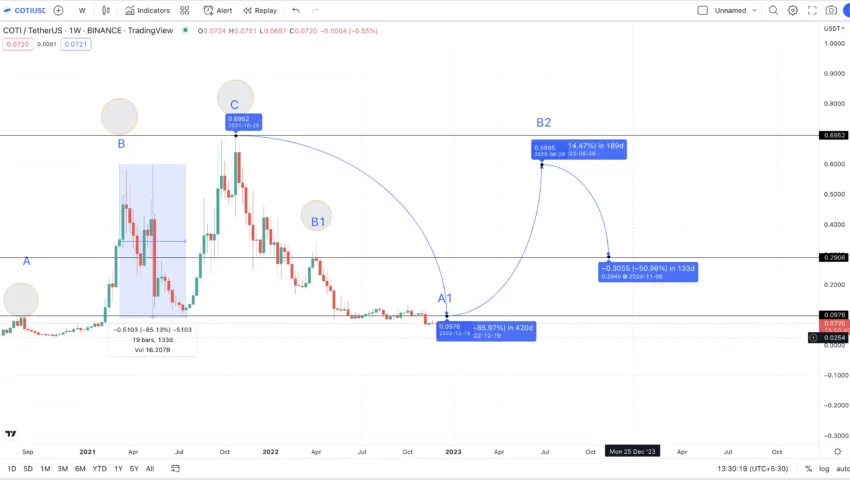 COTI price prediction 2023 charting the lows: TradingView
So: high in 2023 = $0.5995. Low in 2023 = $0.2940
Confirming the short-term pattern with momentum
Outlook: Bullish
Look at the daily price chart closely. You’ll see we have drawn lines at the lows of the price action and also the momentum indicator. The price is making lower lows, whereas, for the same timeframe, the RSI is making higher lows. This is a standard bullish divergence as COTI has been in a downward trend.
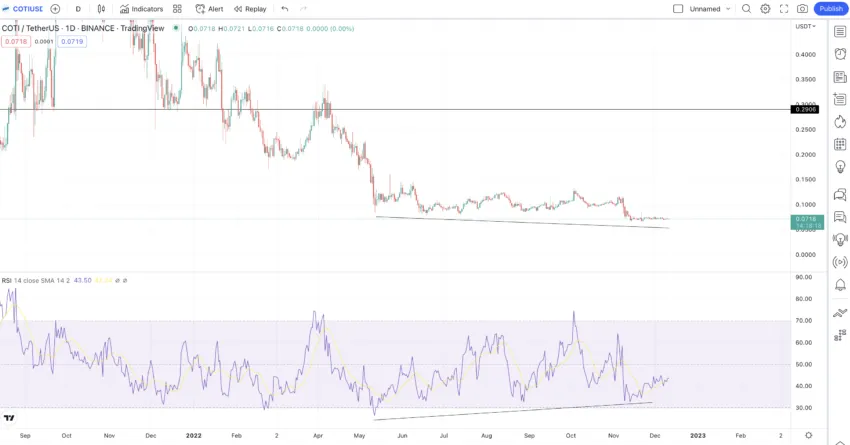 COTI price prediction 2023 using RSI: TradingView
This pattern signifies that a small rally might soon show up at COTI’s counter.
Also, if you see the moving averages (50-day, 100-day, and 200-day), another insight surfaces. The green line, or the 50-day moving average, is trading at the lowest. This explains COTI trading sideways.
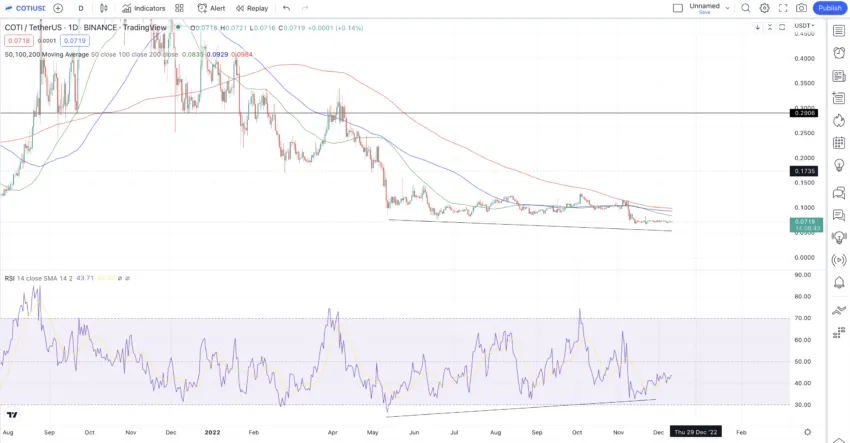 COTI moving averages: TradingView
If the green manages to cross above the blue, then the blue crosses above the red, and we will see multiple golden crossovers. This might lead to a small rally at COTI’s counter.
COTI price prediction 2025
Outlook: Bullish
Several DeFi projects are growing at pace. So, COTI might not be able to keep the same momentum as the first pattern. Here, X to C (low to high) was covered with a 680% growth. A realistic approach would instead be to set Fib levels on the X1 (low of 2023) to see where the next high could show up.
The timeline might remain the same as per the pattern. Therefore, X1 to the next high (C1) could be in 98 days. Per the Fib level resistance and the same path slope, the COTI price prediction for 2024 might come close to $0.04467. This level could show up on Feb. 12, 2024.
Do notice that it is a lower high compared to C.
Also, if we refer to the table earlier, the time difference between the high B1 and C (peak) was 161 days. Hence, the next high should be at 161 days from Feb. 12, 2024. And if the market conditions improve, Fib level extrapolation might hold true from C1.
If the same path is followed, the COTI price prediction for 2024 could make a high of over $0.65, preferably by July 22, 2024.
If the same path holds post-2024, the next high could be at $0.8595. This would be as per Fib levels and the original pattern timeline of 189 days between A and B.
 COTI price prediction 2025: TradingView
By 2025, according to the current market scenario, COTI should form a new all-time high of $0.8595.
COTI price prediction 2030
Outlook: Bullish
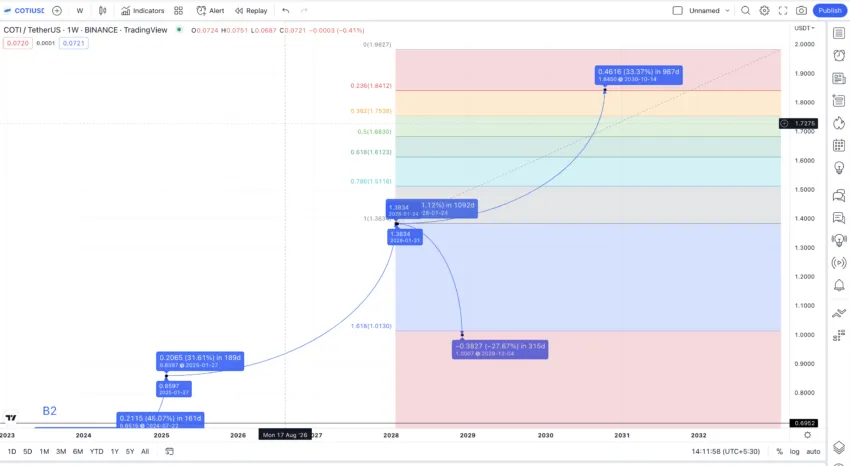
If we further extend the Fib pattern, as per the new high made in 2025, the probable high for 2028 would be at $1.3851. The low that year could be the retraced path to $1.007. This still looks optimistic as the level coincides with the 78.6% Fib level and is still higher than the high projected in 2025.
 COTI price prediction 2025-2030:TradingView
If COTI follows the same path, the maximum price as per COTI price prediction 2030 could land somewhere around $1.8450. Projected lows could be around $1.50. This shows that by this time, COTI would have asserted the long-term up trend.
COTI long-term price prediction 2035
Outlook: Bullish
If you are interested in tracing the COTI’s path till 2035, the following information may help:
| Year | | Maximum price of COTI | | Minimum price of COTI |
| 2023 | $0.5995 | $0.2940 |
| 2024 | $0.65 | $0.325 |
| 2025 | $0.8595 | 0.4300 |
| 2026 | $0.945 | 0.644 |
| 2027 | $1.039 | 0.88 |
| 2028 | $1.3851 | $1.007 |
| 2029 | $1.66 | 1.040 |
| 2030 | $1.8450 | $1.50 |
| 2031 | $2.36 | $1.77 |
| 2032 | $2.59 | $1.95 |
| 2033 | $3.88 | $2.60 |
| 2034 | $4.85 | $3.90 |
| 2035 | $7.28 | $5.35 |
The price action of COTI depends on its growth as a DeFi and enterprise-level fintech project. The COTI price prediction model takes all those factors and even the possible growth of competitors into consideration. Also, the average price of COTI each year should ideally fall between its highest price and the minimum price. Yet, we expect variations depending on the nature of the crypto market.
How accurate is the COTI price prediction?
The COTI price forecast considers long-term and short-term technical indicators. It also covers much more, including coin fundamentals, on-chain metrics, and other insights. Therefore, this COTI price prediction model covers all the important resources to help you track future prices. However, you should always take price projections with a pinch of salt, as the crypto market has a tendency to throw in a few surprises.


