The Bitcoin (BTC), Ethereum (ETH), and XRP price have all broken down from critical horizontal support levels. The trend is considered bearish until these areas are reclaimed.
The Bitcoin price has fallen since reaching an all-time high of $69,000 in Nov. 2021.
BTC Price Breaks Down Below Long-Term Resistance
In June 2022, the BTC price bounced at the $19,000 long-term horizontal support area (green icon). However, the bounce was unsuccessful, and the price broke down during the week of Nov. 7 to 14 (red icon). The $19,000 area is now expected to provide resistance.
If the downward movement continues, the next closest support area would be at $11,500.
Compared to the 2017-2018 correction (highlighted), the current one has taken slightly more time (378 to 364 days) but has had a slightly lower rate of decrease (78% to 84%).
Therefore, reclaiming the $19,000 area would signify that the bottom is in place. This would also create and validate a bullish divergence (green line) for the weekly RSI. Therefore, it would make the future Bitcoin price prediction bullish.
Ethereum Price Prediction
The ETH token is the native token of the Ethereum blockchain, created by Vitalik Buterin. The technical analysis from the daily time frame shows that the price of ETH is trading in a range between $1,030 – $1,250. The Ethereum price fell over the past 24 hours and is now trading close to the bottom of the range.
While the daily RSI is generating bullish divergence, this has yet to be confirmed.
In similar fashion to BTC, a reclaim of the $1,250 area would confirm the bottom. Moreover, a bounce from the current price would validate a bullish divergence (green line) in the daily RSI.
XRP Price
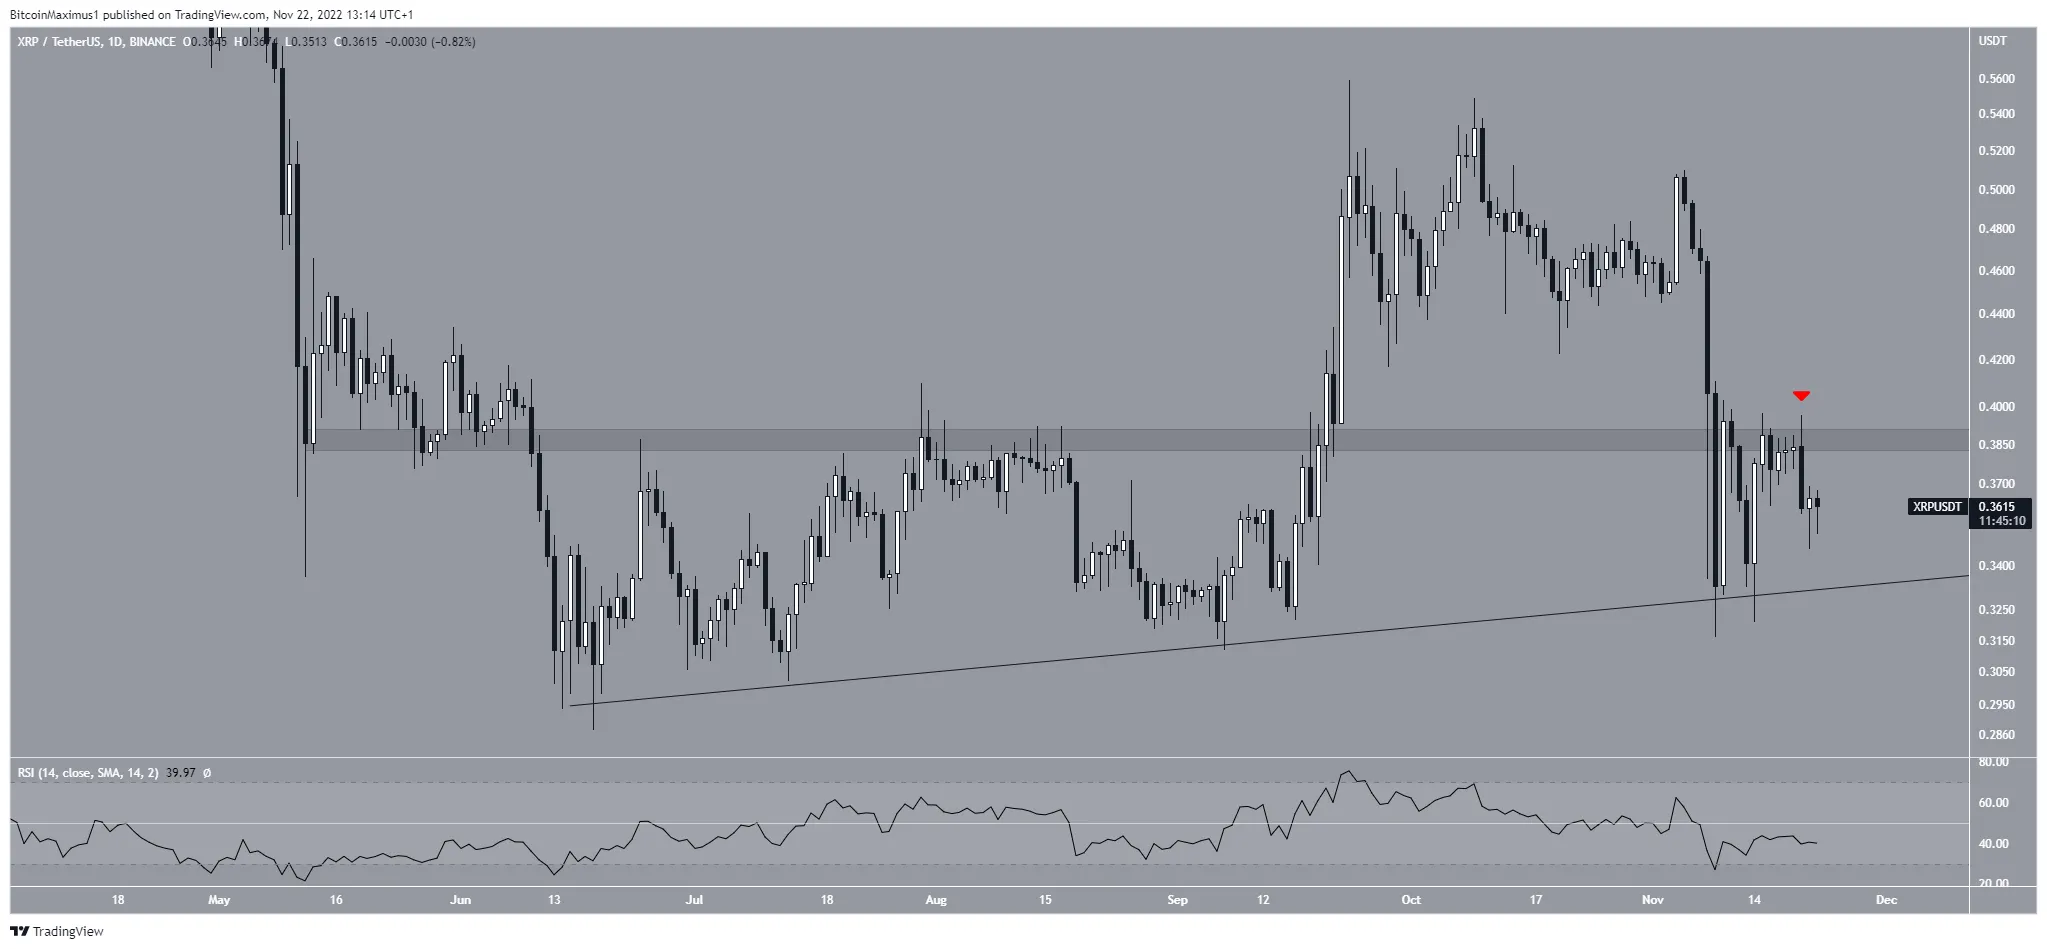
Like the rest of the crypto market, the XRP price has fallen since Nov. 9. The decrease caused a breakdown from the $0.385 resistance area.
Afterward, the XRP price bounced at an ascending support line that has been in place since June 15.
Unlike the other two digital assets in the article, the is no bullish divergence (green line) in place for the XRP price.
So, the future XRP price prediction can be considered bullish if the XRP price reclaims the $0.385 area. Conversely, it will be considered bearish if the XRP price breaks down from the ascending support line.
 XRP/USDT Chart By TradingView
For BeInCrypto’s latest crypto market analysis, click here.
Disclaimer: BeInCrypto strives to provide accurate and up-to-date news and information, but it will not be responsible for any missing facts or inaccurate information. You comply and understand that you should use any of this information at your own risk. Cryptocurrencies are highly volatile financial assets, so research and make your own financial decisions.


