Be[In]Crypto takes a look at the five cryptocurrencies that increased the most last week, more specifically from May 28 to July 3.
These cryptocurrencies are:
- Waves (WAVES) : 116.47%
- Cardano (ADA) : 25.70%
- Internet Computer (ICP) : 23.65%
- Stellar (XLM) : 21.56%
- Helium (HNT) : 20.42%
WAVES
WAVES has been falling since reaching an all-time high price of $63.88 on March 31. The downward movement led to a low of $4.13 on May 29. Afterwards, it initiated a sharp upward movement that is still ongoing.
Since its May 29 lows, WAVES has increased by 140% and reclaimed the $9 horizontal area in the process.
If the increase continues, the closest horizontal resistance level is at $16 while the closest Fib resistance level is at $27.
/Related
MORE ARTICLES
UK National Crime Agency Announces Unit to Tackle Crypto Crime
Avalanche (AVAX) Price Is Edging Closer to a Bullish Breakout
JP Morgan Still Dabbling in Crypto, but Is the Bank Serious About Adoption?
Crypto.com (CRO) Price May Dip Further in Search of Support
Bitcoin Will Reach $33,000 in April 2023 – Cycle Analysis
What Bear Market? Web3 Investments Soared in 2022, up $4.5B on Previous Year
WAVES/USDT Chart By TradingView
ADA
ADA has been increasing inside an ascending parallel channel since May 12. Such channels usually contain corrective movements, meaning that a breakdown from it would be likely.
On May 31, the price was rejected by the resistance line of the channel (red icon) and has been falling since. It is currently holding on above the middle of the channel (red circle). A decrease below this level would indicate that a breakdown and lower prices are forthcoming.
ADA/USDT Chart By TradingView
ICP
ICP has been falling since it was rejected on June 2 (red icon). The downward movement served to validate the $9.40 area as resistance.
If the decrease continues the closest support would be at $7.70, created by an ascending support line.
ICP/USDT Chart By TradingView
XLM
XLM has been falling underneath a descending resistance line since April 4. The downward movement led to a low of $0.10 on May 12.
XLM bounced afterwards and broke out from the line on May 30.
It is currently attempting to break out from the $0.155 resistance area. If it is successful in doing so, the next resistance would be at $0.187.
XLM/USDT Chart By TradingView
HNT
HNT has been falling underneath a descending resistance line since Nov 7. The downward movement led to a low of $6.24 on May 12.
The price bounced afterwards, seemingly creating a double bottom pattern. But it was rejected by the $10 resistance area on May 30 (red icon) and has been falling since. The $10 area also coincides with the aforementioned descending resistance line.
Until HNT manages to reclaim both of them, the trend cannot be considered bullish.
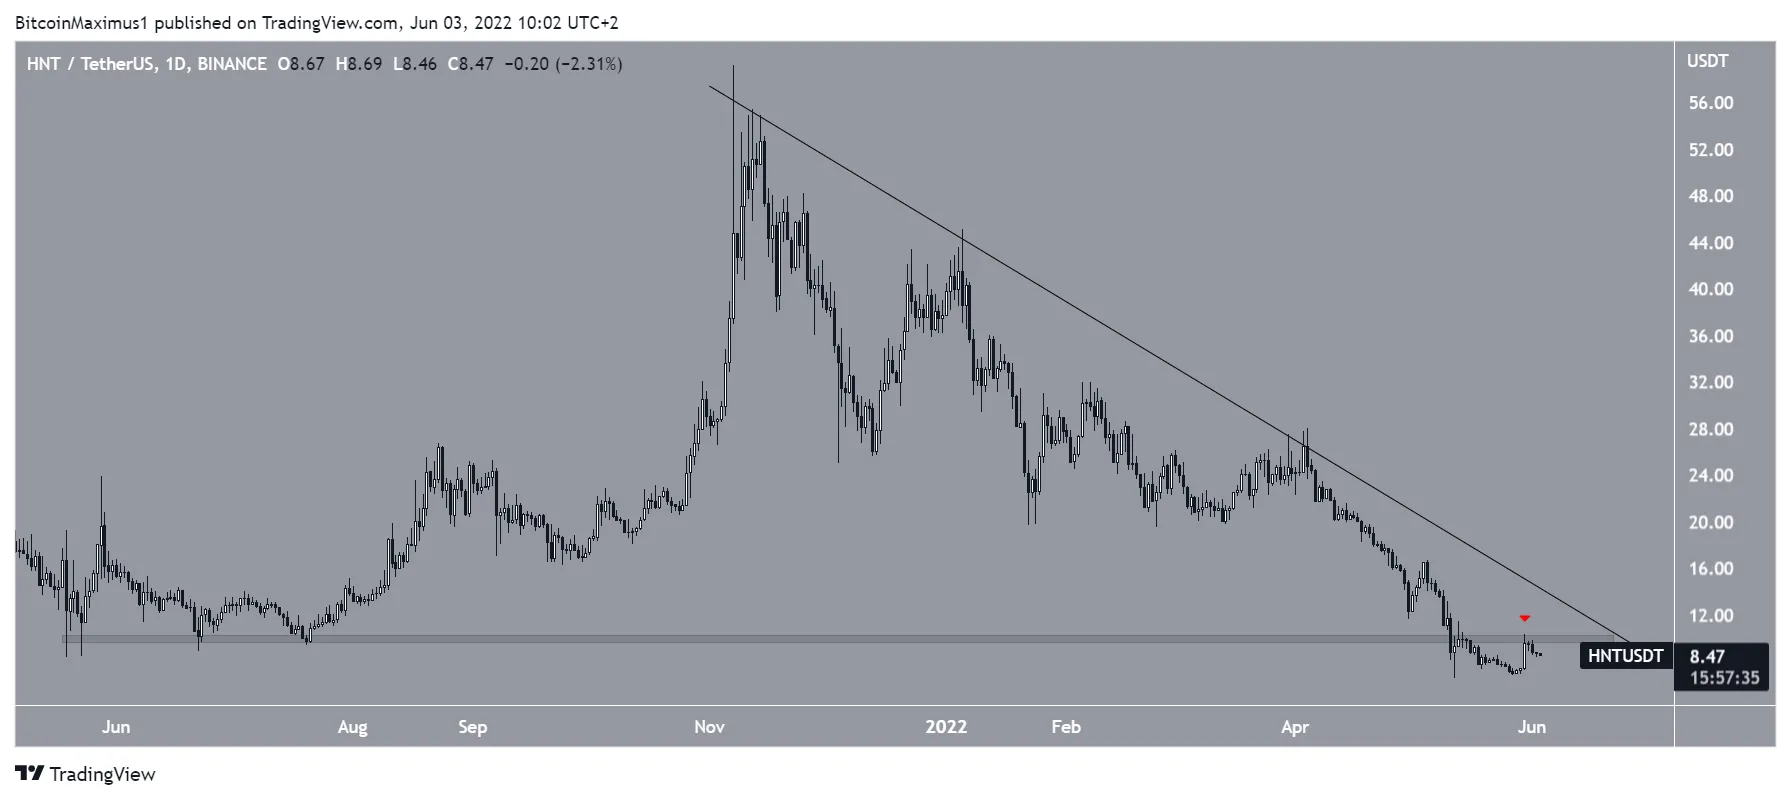 HNT/USDT Chart By TradingView