
The European Blockchain Convention is being held during April 12-16. One of the most important speakers will be Denelle Dixon, the CEO of the Stellar Development Foundation.
Three altcoins rallying while the convention takes place online are Cardano (ADA), Neo (NEO), and Stellar (XLM).
Cardano (ADA) has broken out from a symmetrical triangle and aims for a new all-time high price.
Neo (NEO) has broken out from a short-term descending resistance line and approaches a long-term resistance level.
Stellar (XLM) also has broken out from a long term resistance level and may rally even further.
Cardano (ADA)
ADA had been trading inside a symmetrical triangle since reaching an all-time high price of $1.488 on Feb. 27. This is likely to have been wave four of a long-term bullish impulse (white). ADA broke out from the triangle today.
/Related
MORE ARTICLES
Why Is the Crypto Market Up Today?

BlockFi To Reveal Financial State Post FTX Collapse and Bankruptcy Filing

Will Crypto Volatility Crunch Precede an Explosive Move for BTC and ETH?

Quantum Computers Break Encryption in China But Far From Cracking Bitcoin
GALA 230% Pump Compromised by Hefty Crypto Distribution Schedule
Flare Network Airdrop Kicks Off for Eligible XRP Holders
Potential targets for the top of this movement are located at $2.05 and $2.60. The targets are found using a Fib projection on the length of waves 1-3.
Technical indicators support the continuation of the upward movement. The MACD has given a bullish reversal signal, and both the RSI & Stochastic oscillator are increasing.
Therefore, ADA is expected to continue increasing towards the targets.
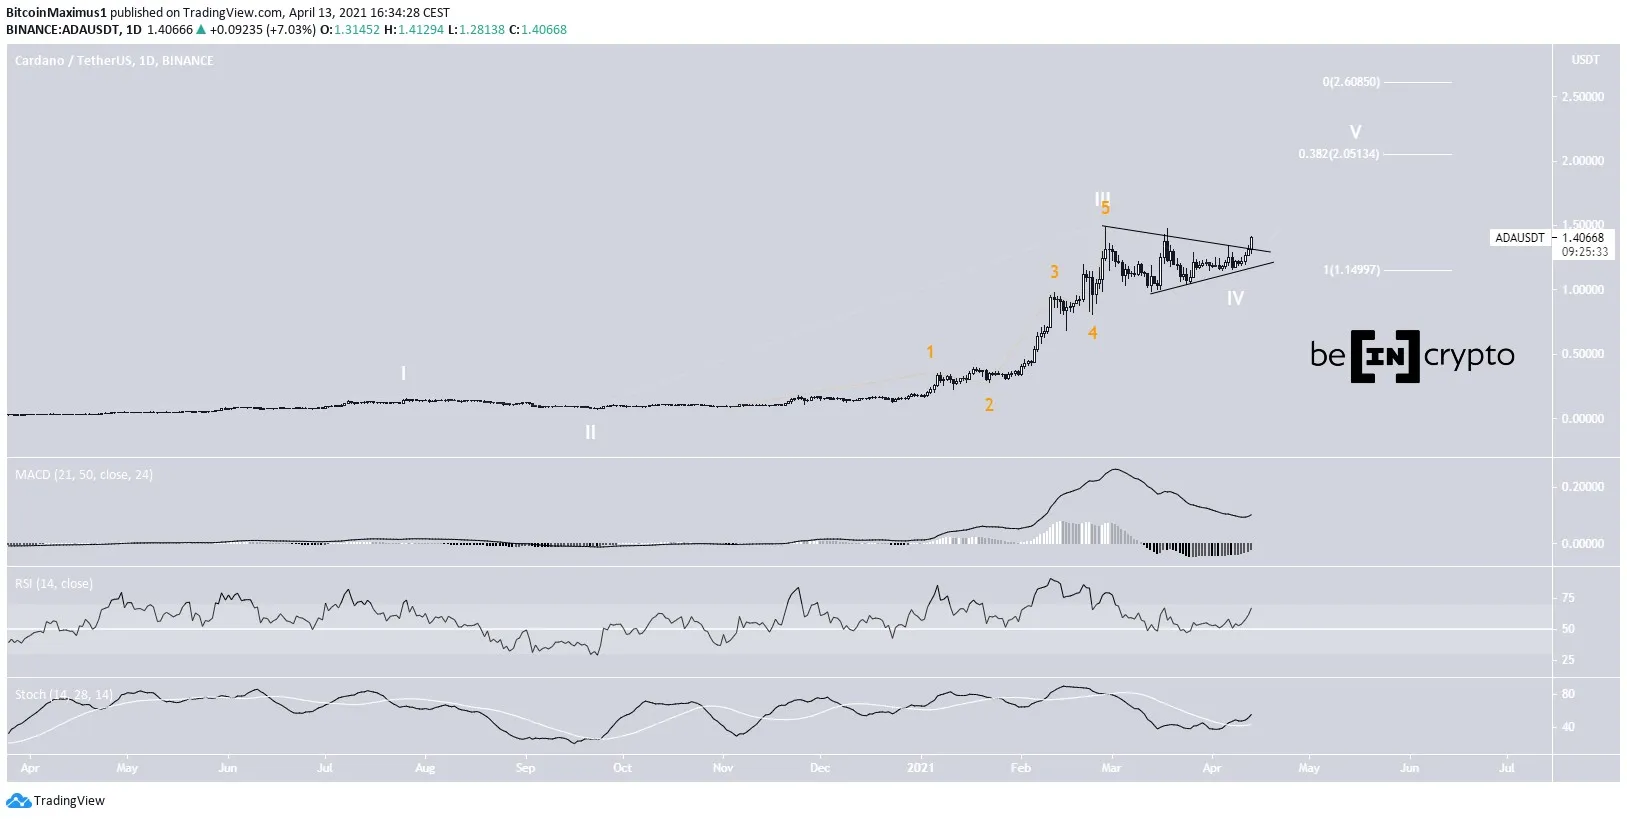 Chart By TradingView
The shorter-term chart supports this possibility.
It shows a potential ascending triangle, with the resistance area being at $1.48.
This short-term pattern supports the bullish outlook from the daily reading.
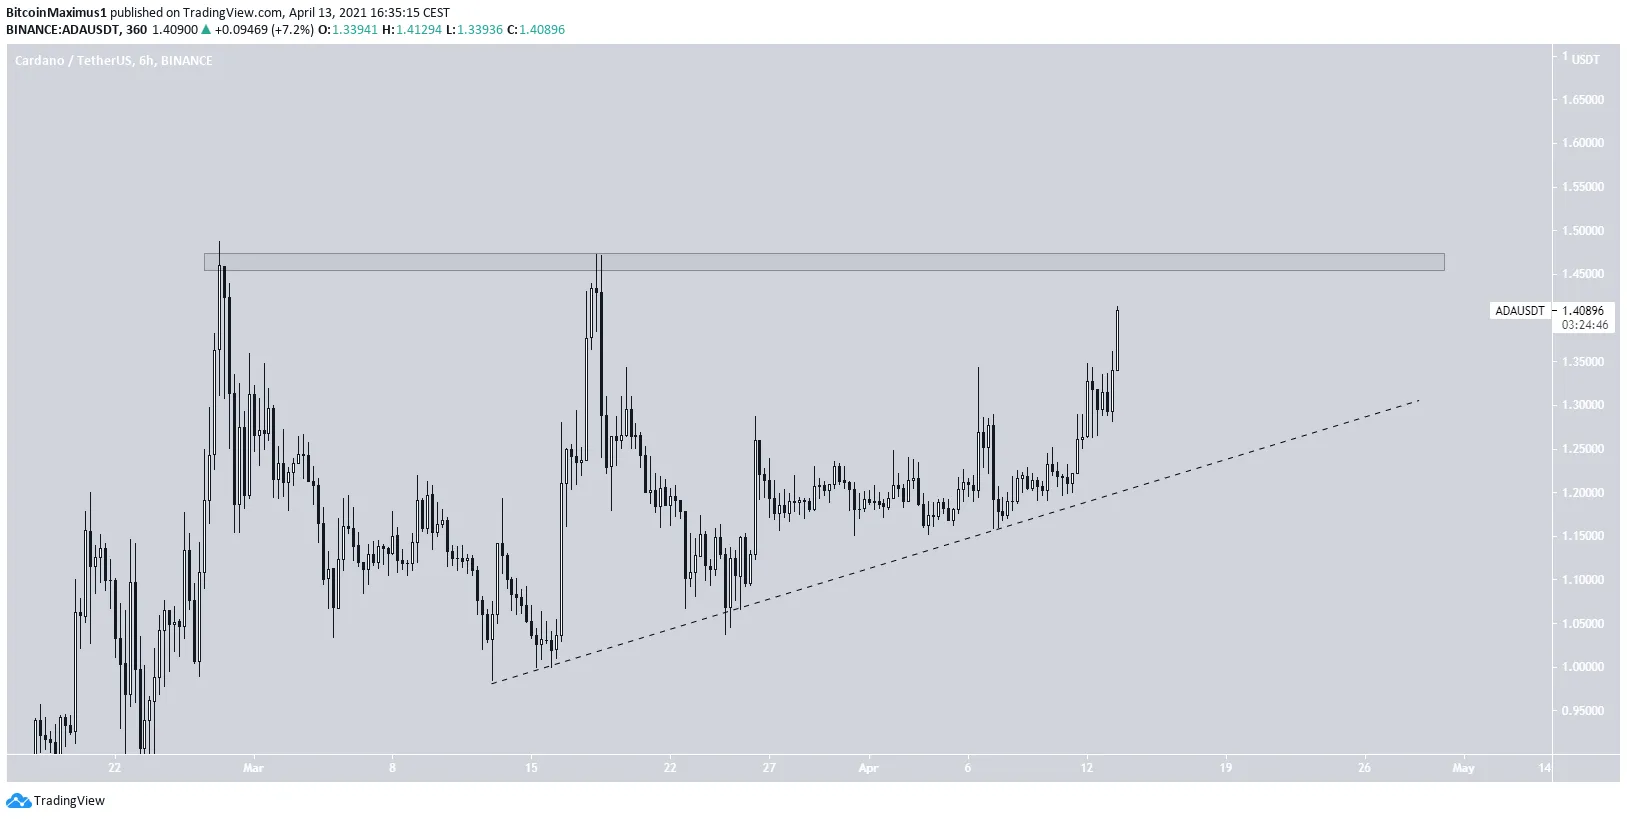 Chart By TradingView
Highlights
- ADA has broken out from a symmetrical triangle.
- There is resistance at $1.48.
Neo (NEO)
Since the beginning of February, NEO moved upwards when a rapid drop took it to a low of $31.30.
So far, it has managed to reach a high of $68.5. NEO is approaching the $76 and $98 resistance areas. The confluence of Fib retracement levels finds both.
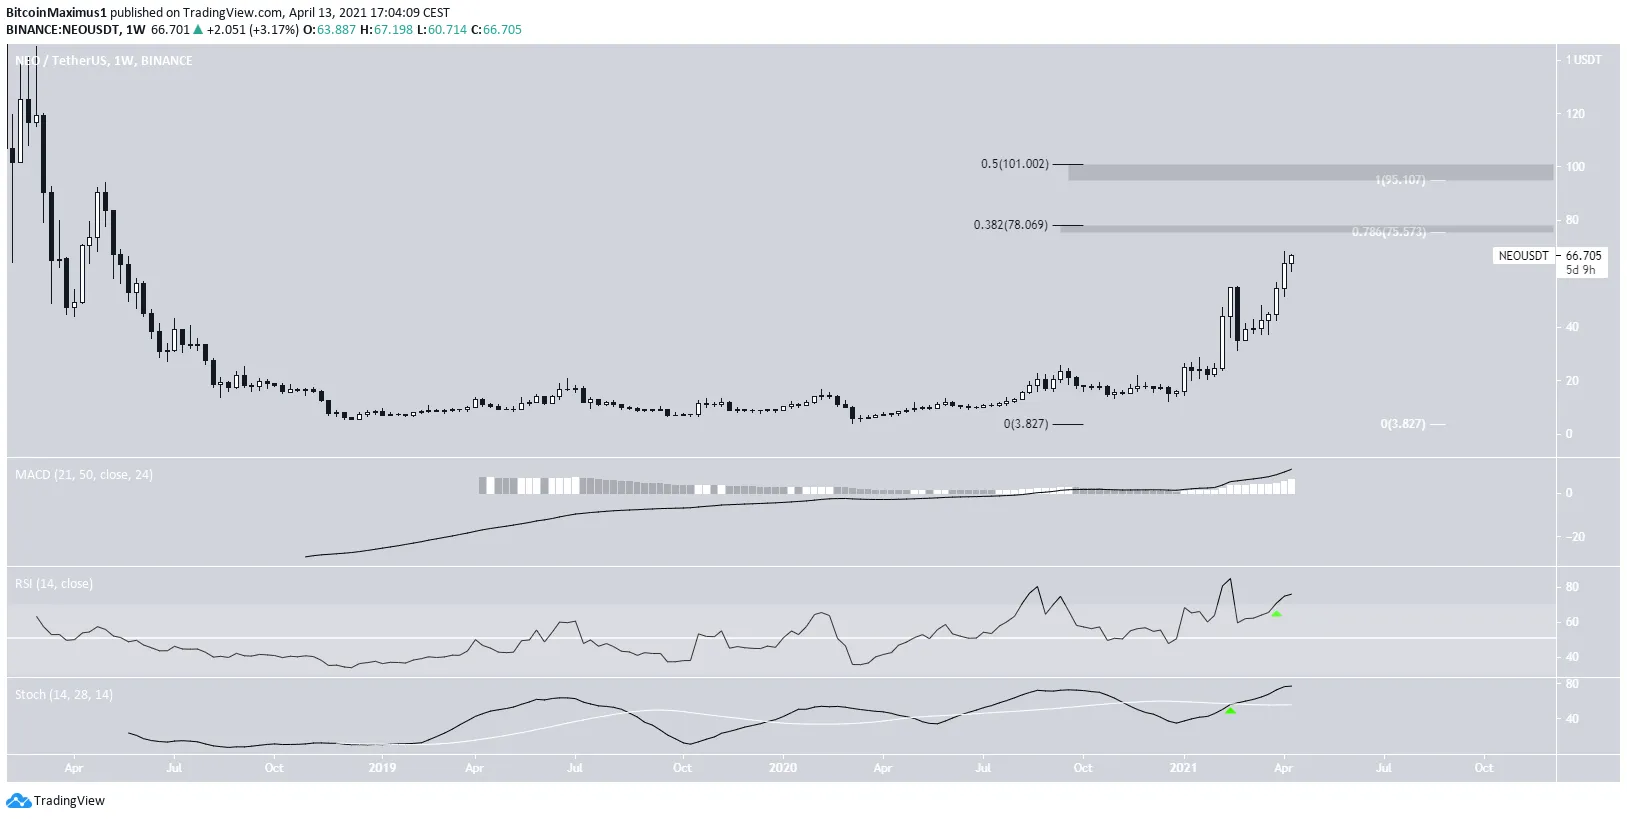 Chart By TradingView
The shorter-term two-hour chart supports this possibility. NEO has already broken out from a descending resistance line.
Both the MACD & RSI support the continuation of the upward movement towards the previously given targets.
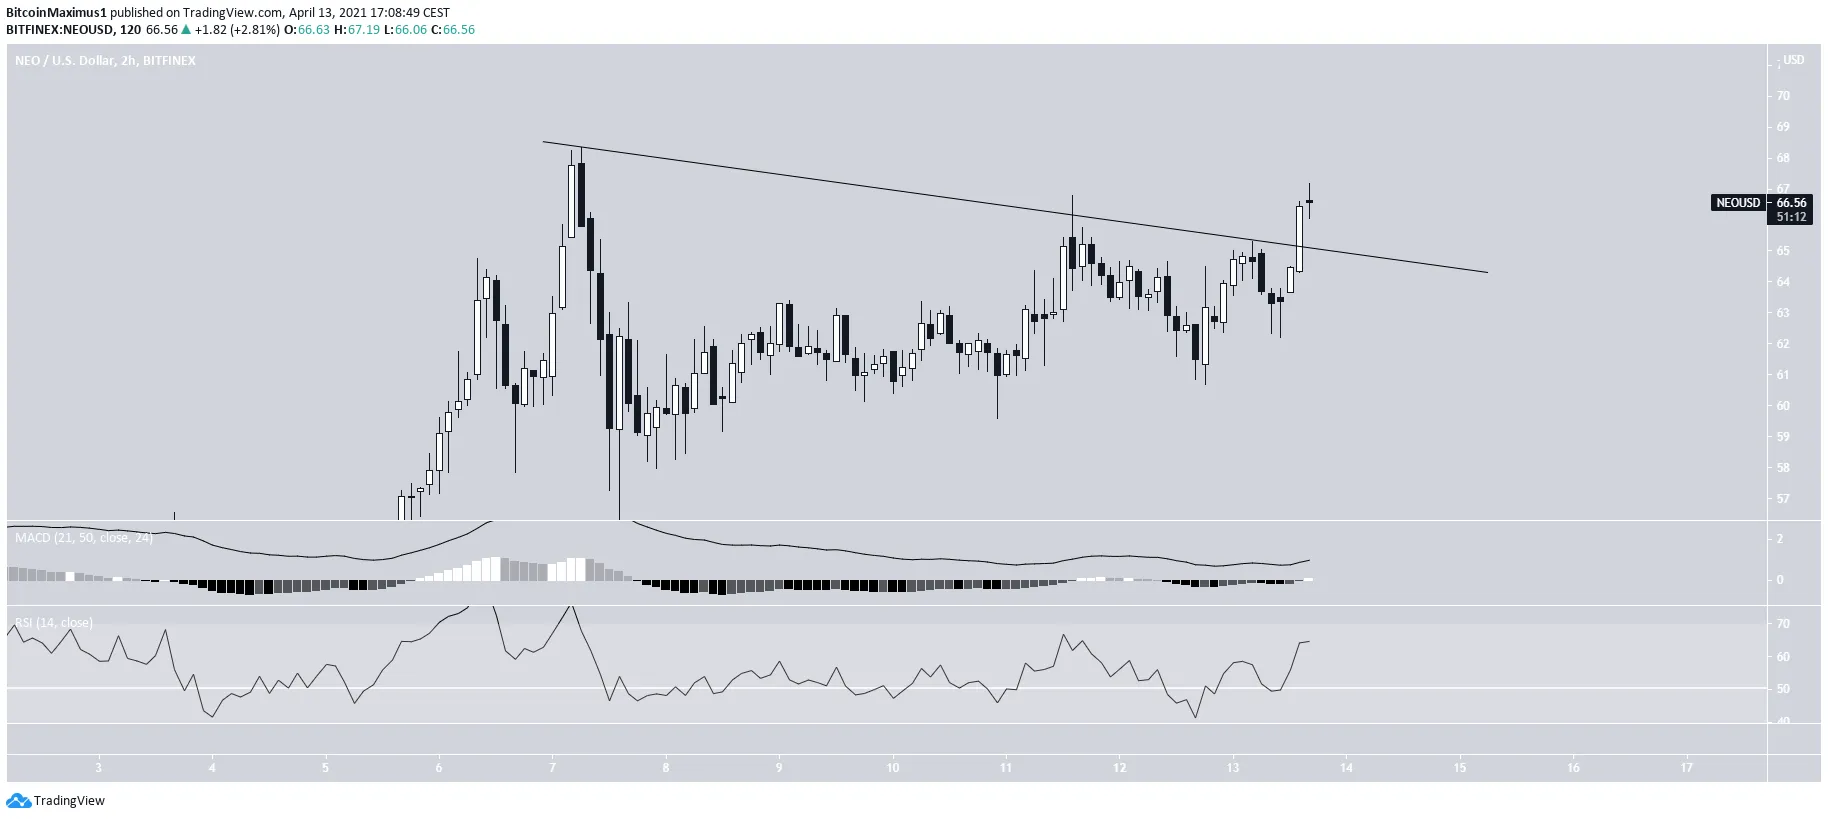 Chart By TradingView
Highlights
- NEO is facing resistance at $76 and $98.
- NEO has broken out from a short-term descending resistance line.
Stellar (XLM)
Last week, XLM managed to break out above the 0.5 Fib retracement resistance at $0.537.
This is a long-term resistance level that had been in place since 2018.
Currently, it is trading right at the 0.618 Fib resistance at $0.65.
Technical indicators are bullish, supporting the possibility that XLM breaks out.
If so, there is virtually no resistance until the all-time high price of $1.05.
Chart By TradingView
The shorter-term chart supports this possibility.
Technical indicators are bullish, and XLM has managed to reclaim the $0.55 horizontal level.
There is minor resistance at $0.8 before the previously outlined all-time high level.
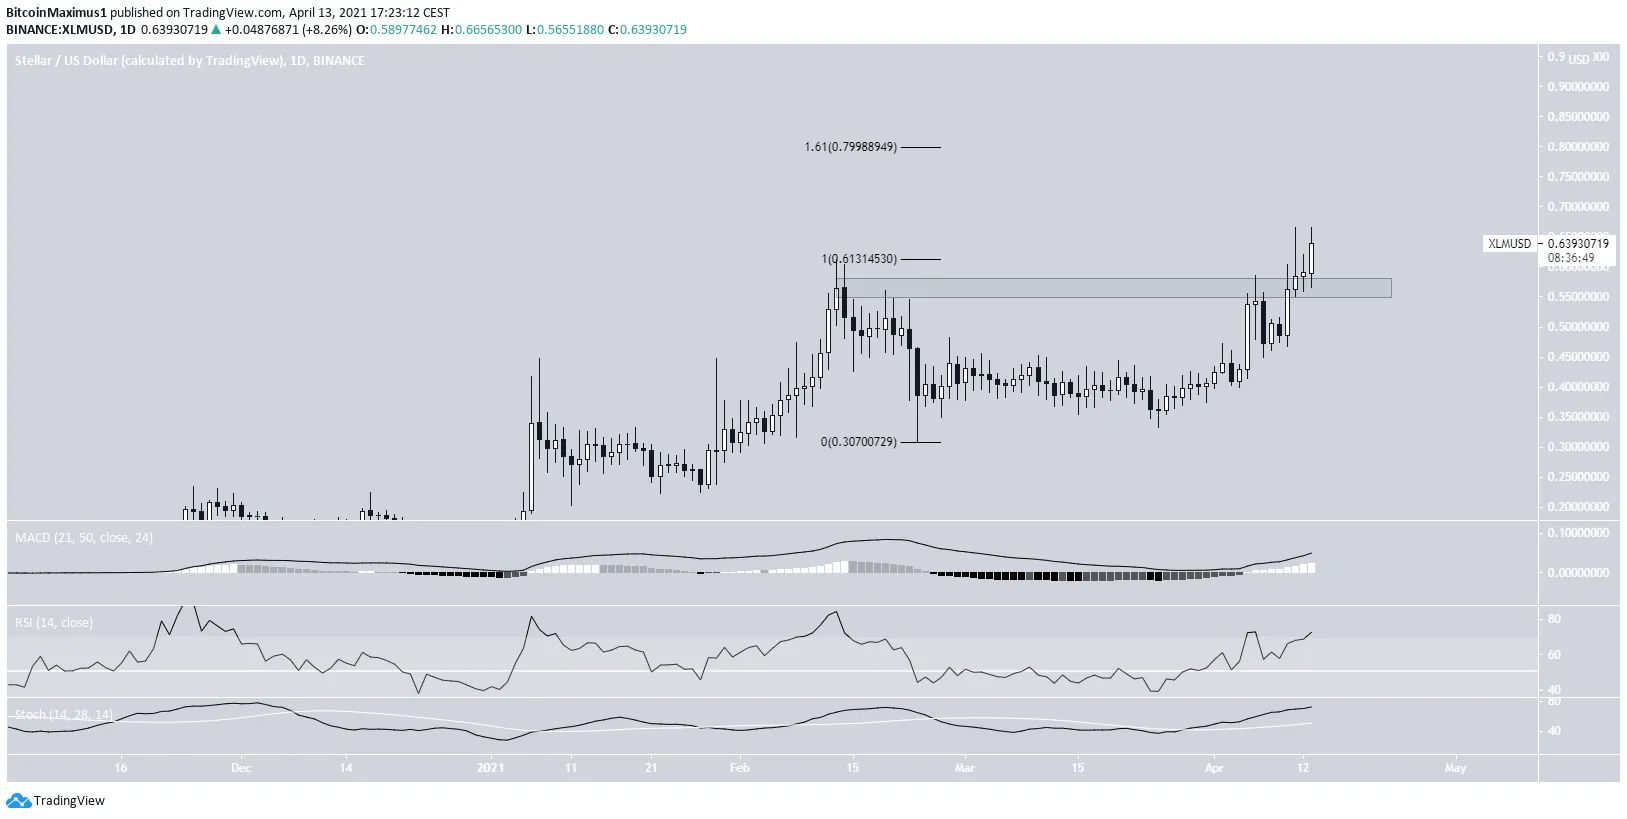 Chart By TradingView
- XLM has broken out from the $0.583 resistance area.
- There is resistance at $0.80.


