Bitcoin (BTC) is retracing and attempting to find support.
Ethereum (ETH) is re-testing the previous all-time high as support.
XRP (XRP) is moving upwards and has nearly reached a long-term resistance level.
Cardano (ADA) is trading inside a symmetrical triangle, from which a breakout is expected.
Tezos (XTZ) reached a new all-time high price on April 6.
Solana (SOL) reached a new all-time high on April 4 and is currently gearing up for another upward movement.
/Related
MORE ARTICLES
How Litecoin (LTC) Price Will Perform Ahead of August’s Halving

Do Kwon Suggests Sicking FBI on Man Who Accidentally Received $1.5M in LUNA

Why Is the Crypto Market Up Today?
BlockFi To Reveal Financial State Post FTX Collapse and Bankruptcy Filing
Will Crypto Volatility Crunch Precede an Explosive Move for BTC and ETH?
Quantum Computers Break Encryption in China But Far From Cracking Bitcoin
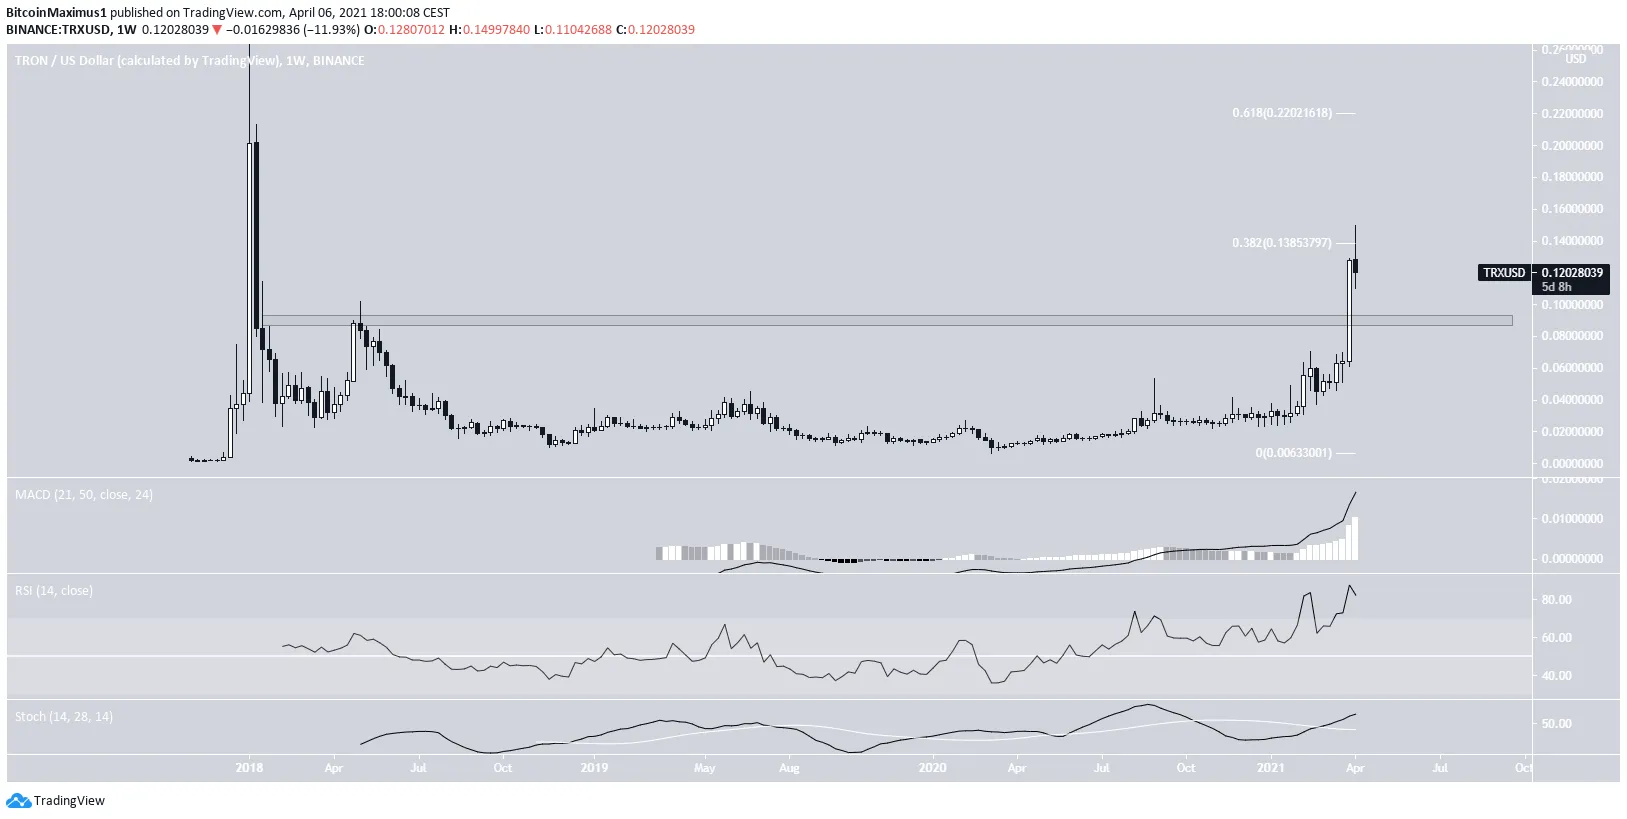
Tron (TRX) increased considerably last week and reached a long-term resistance area at $0.138.
Bitcoin (BTC)
Bitcoin has been decreasing since it was rejected by the $59,500 resistance area earlier today.
Both the MACD & RSI support the decrease. The former has crossed into negative territory while the latter has decreased below 50.
BTC could continue decreasing in the short-term towards $56,500 and potentially $55,300.
Nevertheless, the longer-term trend remains bullish, and BTC is expected to reach a new all-time high price soon.
Ethereum (ETH)
ETH reached a new all-time high price on April 2. Afterward, it retraced and validated the $2000 level as support. The same area previously acted as resistance.
Technical indicators support the continuation of the upward movement. This is especially visible in the Stochastic oscillator, which has made a bullish cross.
The wave count suggests that ETH could potentially increase all the way to $3000.
XRP (XRP)
XRP has increased considerably over the past few days, reaching a high of $1.09 today.
Despite the considerable increase, XRP has yet to reach the 0.382 Fib retracement of the prior downward movement.
The level is found at $1.35 and expected to act as resistance once XRP gets there.
Technical indicators in the weekly time frame are bullish. This is especially evident by the RSI cross above 70 and the bullish cross in the Stochastic oscillator.
Therefore, XRP is expected to reach this level and eventually break out. For the long-term wave count, click here.
Cardano (ADA)
Since reaching a new all-time high price on Feb. 27, ADA has been trading inside a symmetrical triangle.
This is a neutral pattern, but a breakout from it is expected. This is due to the bullish reading from technical indicators, especially the bullish cross in the Stochastic oscillator.
Also, it is because of the bullish wave count, which provides potential targets at $2.05 and $2.60.
Tezos (XTZ)
On March 31, XTZ reclaimed the $4.45 area, which previously had acted as resistance. Since then, it has been moving upwards with strength.
On April 6, it reached a new all-time high price of $6.80.
While it has decreased slightly, XTZ has yet to reach the $7.34 resistance area, the 1.61 external retracement of the most recent drop.
XTZ is expected to reach it and potentially move towards the next resistance at $10.
Solana (SOL)
SOL has increased considerably since March 26. On April 4, it reached an all-time high price of $25.53. This measured an increase of 107.5% in nine days.
Currently, it is attempting to created support near the $22.50 level.
If successful, it would be expected to increase towards the next resistance area at $29.5.
Tron (TRX)
TRX increased considerably last week and eventually managed to reach a high of $0.149.
However, it was rejected by the long-term $0.135 resistance are and has been decreasing since. The resistance is the 0.382 Fib retracement level of the entire previous upward movement.
Nevertheless, technical indicators are bullish.
Therefore, after a potential retracement towards $0.095, TRX is expected to resume its upward movement.
 TRX Chart By TradingView


