The Bitcoin (BTC) price has bounced at an ascending support line which coincides with a horizontal support area.
Ethereum (ETH) was temporarily rejected below $2,000 but is expected to find support near $1,700.
XRP (XRP) is trading in a range between $0.36-$0.63.
Cardano (ADA) has returned in order to validate the previous all-time high resistance at $1 and bounced after.
EOS (EOS) is trading inside a parallel ascending channel.
After reaching a new all-time high price on Feb. 14, Tezos (XTZ) dropped below the previous all-time high resistance area. This level was expected to act as support.
/Related
MORE ARTICLES
How Litecoin (LTC) Price Will Perform Ahead of August’s Halving

Do Kwon Suggests Sicking FBI on Man Who Accidentally Received $1.5M in LUNA

Why Is the Crypto Market Up Today?
BlockFi To Reveal Financial State Post FTX Collapse and Bankruptcy Filing
Will Crypto Volatility Crunch Precede an Explosive Move for BTC and ETH?
Quantum Computers Break Encryption in China But Far From Cracking Bitcoin
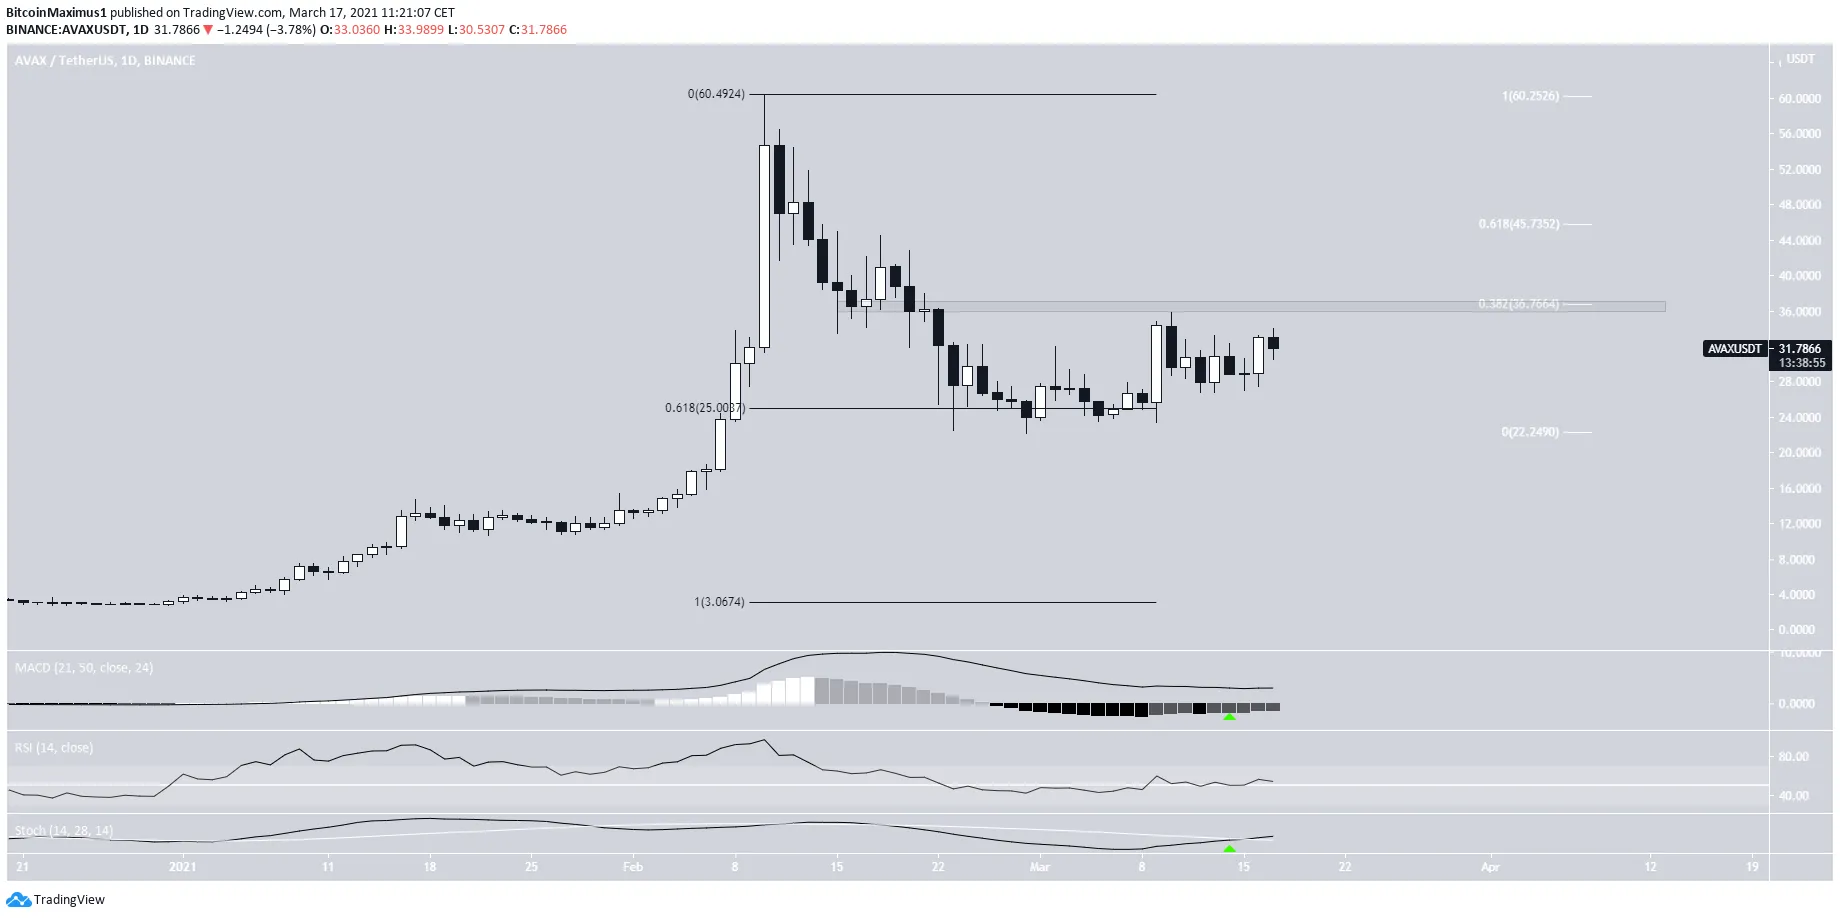
Avalanche (AVAX) has bounced at the $25 support area.
Bitcoin (BTC)
BTC has been following an ascending support line since the beginning of March.
After reaching an all-time high price of $61,844 on March 13, BTC began a downward move. The drop took it back to the support line, which also coincides with the $54,550 horizontal support area.
BTC has begun a bounce, which is supported by the bullish reversal in the short-term MACD. Despite the return to this support line, the trend is considered bullish as long as BTC does not close below it.
Ethereum (ETH)
Similar to BTC, ETH has been increasing since Feb. 28. So far, it has managed to reach a high of $1,944.60 on March 13.
While ETH has dropped slightly since then, the decrease does not look impulsive.
Furthermore, it’s still trading above the 0.382 Fib retracement level at $1,696.
The MACD has turned bullish and the RSI is expected to follow suit soon.
Therefore, ETH is expected to bounce at this support area and continue higher.
If it reaches a new all-time high, the next resistance area would be found at $2,500.
XRP (XRP)
XRP has been moving downwards since it reached a high of $0.65 on Feb. 22.
The drop took it to the $0.36 support area the next day, and XRP began the current bounce.
Despite the increase, XRP is still stuck inside the $0.36-$0.63 range.
Furthermore, technical indicators are neutral.
Therefore, until XRP breaks out or down from this range, the direction of the trend is undetermined.
Cardano (ADA)
ADA has been moving downwards since reaching an all-time high price of $1.54 on Feb. 27.
The drop has taken it to the previous all-time high resistance area of $1. Therefore, the current decrease looks like a bullish retest. After testing the level, ADA began a bounce which is still ongoing. So far, it has reached a high of $1.32.
The increase is also supported by the hidden bullish divergence in the RSI. Furthermore, the MACD and Stochastic oscillator are increasing. These readings suggest that the long-term trend is bullish.
Therefore, ADA is expected to gradually increase and eventually reach a new all-time high price.
EOS (EOS)
EOS has been increasing since reaching a low on Feb. 23. However, the increase has taken the shape of a parallel ascending channel, which is often corrective.
Technical indicators are neutral, failing to confirm the direction of the trend.
Therefore, it’s likely that EOS breaks down from this channel and could potentially drop back to the $3.10 support area.
Tezos (XTZ)
XTZ reached a new all-time high price of $5.64 on Feb 14. It decreased immediately after. This move has acted to validate the previous all-time high resistance at $4.40 as support.
However, XTZ broke down instead and has now validated the area as resistance.
Technical indicators are relatively neutral. While the Stochastic oscillator and MACD are partly bullish, the RSI is partly bearish.
XTZ is still following an ascending support line. Whether it breaks down from this line or reclaims the $4.50 level will likely determine the direction of the trend.
Avalanche (AVAX)
AVAX has been moving downwards since reaching an all-time high of $60.35 on Feb. 10. The drop has taken it to the 0.618 Fib support at $25, where AVAX has bounced.
Both the Stochastic Oscillator and MACD have turned bullish, supporting the continuation of the upward movement.
The two closest resistance areas are found at $36.70 and $45.70.
 AVAX Chart By TradingView


