Current Movement
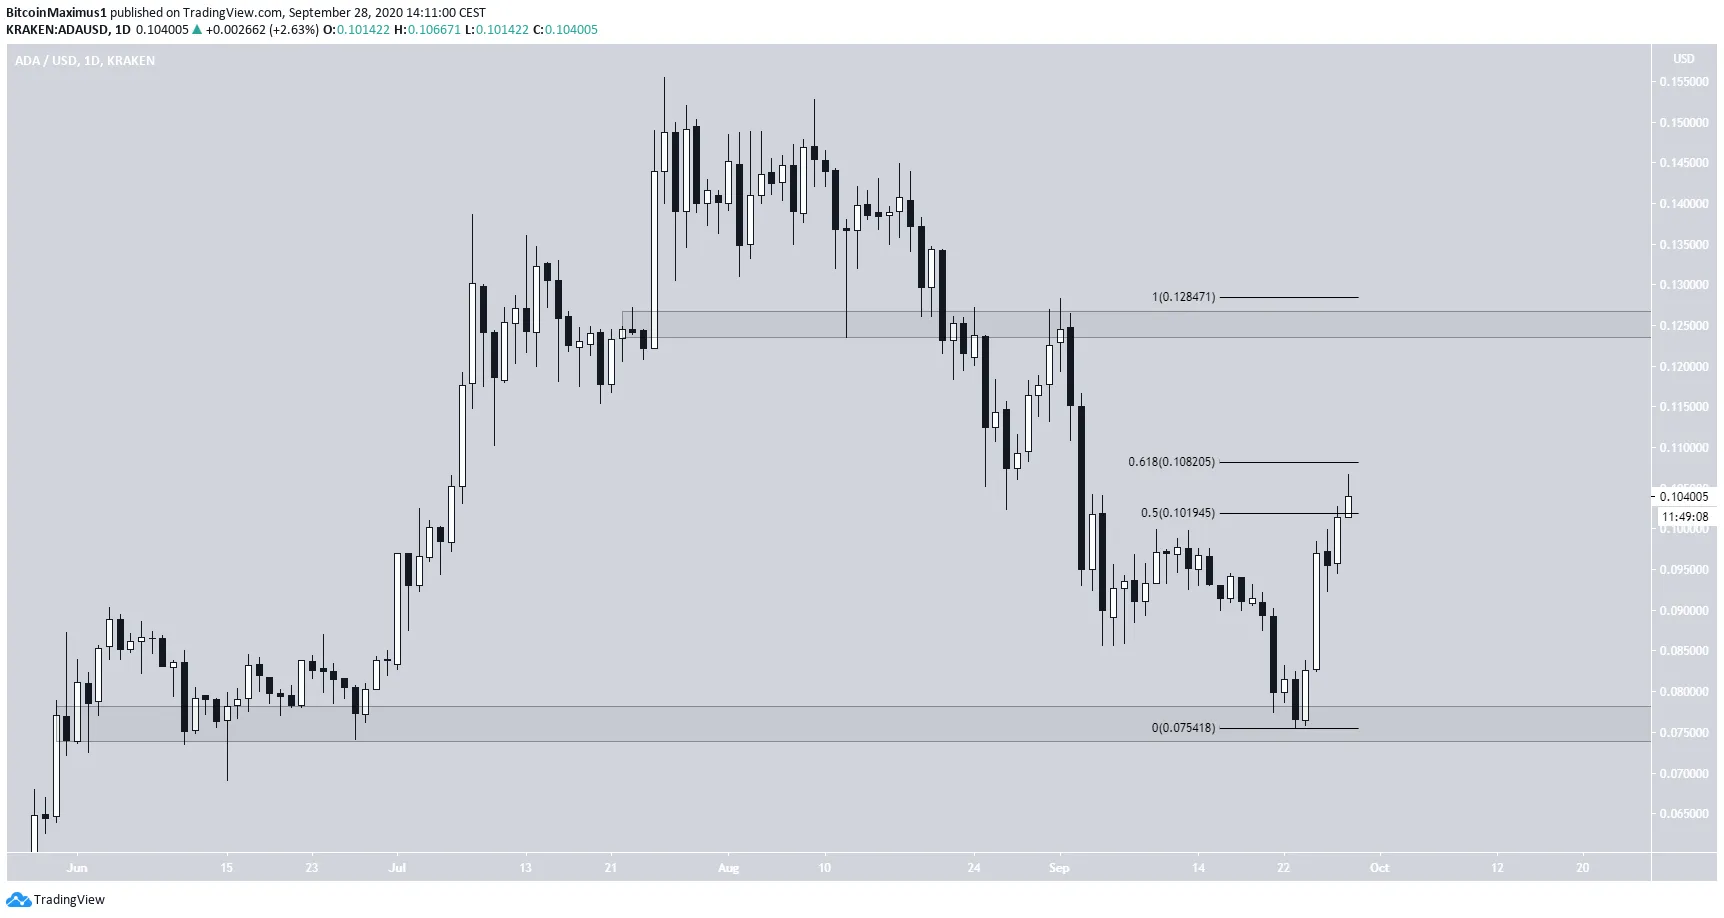
The ADA price has been falling since July 24, when it reached a top of $0.154. The decline continued without much relief until a low of $0.075 was reached on Sept 23. Since then, the price has begun a rapid upward move. At the time of writing, ADA was trading inside a minor resistance area found between $0.102 – $0.108, the 0.5 – 0.618 Fib levels of the previous decline. In a broader range, ADA is trading between support and resistance at $0.075 and $0.125, respectively.
 ADA Chart By TradingView
On the daily time-frame, technical indicators are bullish:
- The MACD has generated bullish divergence and is increasing.
- The RSI has moved above 50
- The Stochastic Oscillator has made a bullish cross and is also moving upwards.
These are signs that the price is likely to continue moving upwards.
Short-Term
Cryptocurrency trader @crypto618 outlined an ADA chart, which shows that the price has just reached the resistance line of a descending channel. They predict a price fall.
Since posting the tweet, the price has already broken out from the descending resistance line but has not moved upwards with strength. The MACD is still increasing, but the RSI has started to form bearish divergence, a sign of weakness. Therefore, we could see a decline that validates the resistance line the price just broke out from and the minor $0.10 support area before the price resumes its upward movement.
Wave Count
In BeInCrypto’s previous analysis, it was stated that,
the decrease could end at $0.078 if sub-waves A to C have a 1:1 ratio, which is quite common.
The price reached a low of $0.074 and began the current upward movement. The move from the lows looks impulsive, so this may be the beginning of a new upward trend.
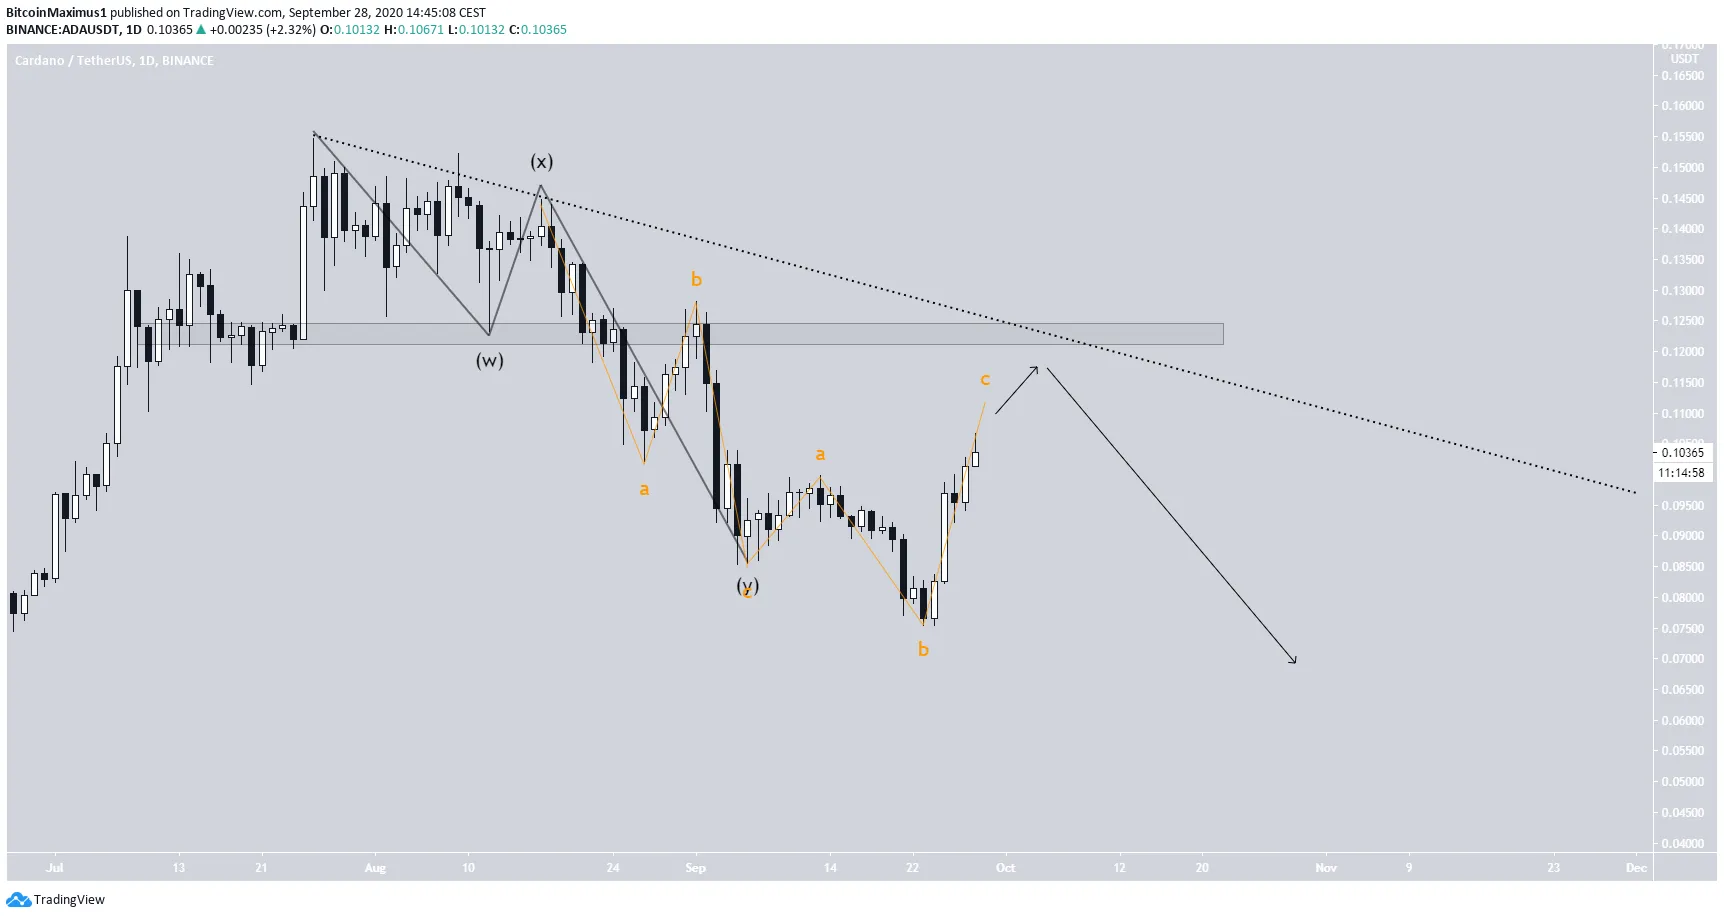
However, the longer-term count is not clear. The most likely scenario is that the price has completed a complex W-X-Y correction (shown in black below), in which the A:C waves had a 1:1 ratio (orange). If so, then the current movement is an upward A-B-C correction (orange), which explains the impulsive move from the lows, since the C wave comprises an impulse. The previously mentioned $0.125 resistance area also coincides with a descending resistance line drawn from the Jul, 24 high. So until the price successfully breaks out, the current move could be a correction rather than the beginning of a new upward trend.
 ADA Chart By TradingView
To conclude, while ADA could increase in the short-term, the direction of the longer-term trend is uncertain unless the price breaks out above $0.123. There are conflicting signs from technical indicators, horizontal levels, and Elliott wave theory, making it difficult to determine the direction of the future trend.


