
Long-Term ADA Movement
The weekly chart for ADA shows a double bottom combined with significant bullish divergence on the weekly RSI from August 2019 – March 2020. On March 12, the price created a long lower wick and has been increasing ever since. After another long lower wick on June 15, the price has been moving upwards at an accelerated pace. However, the weekly RSI is overbought, and there is hidden bearish divergence, which if confirmed, would negate the previous bullish divergence that initiated the entire upward move. The closest support and resistance areas are found at 1200 and 1800 satoshis, respectively.
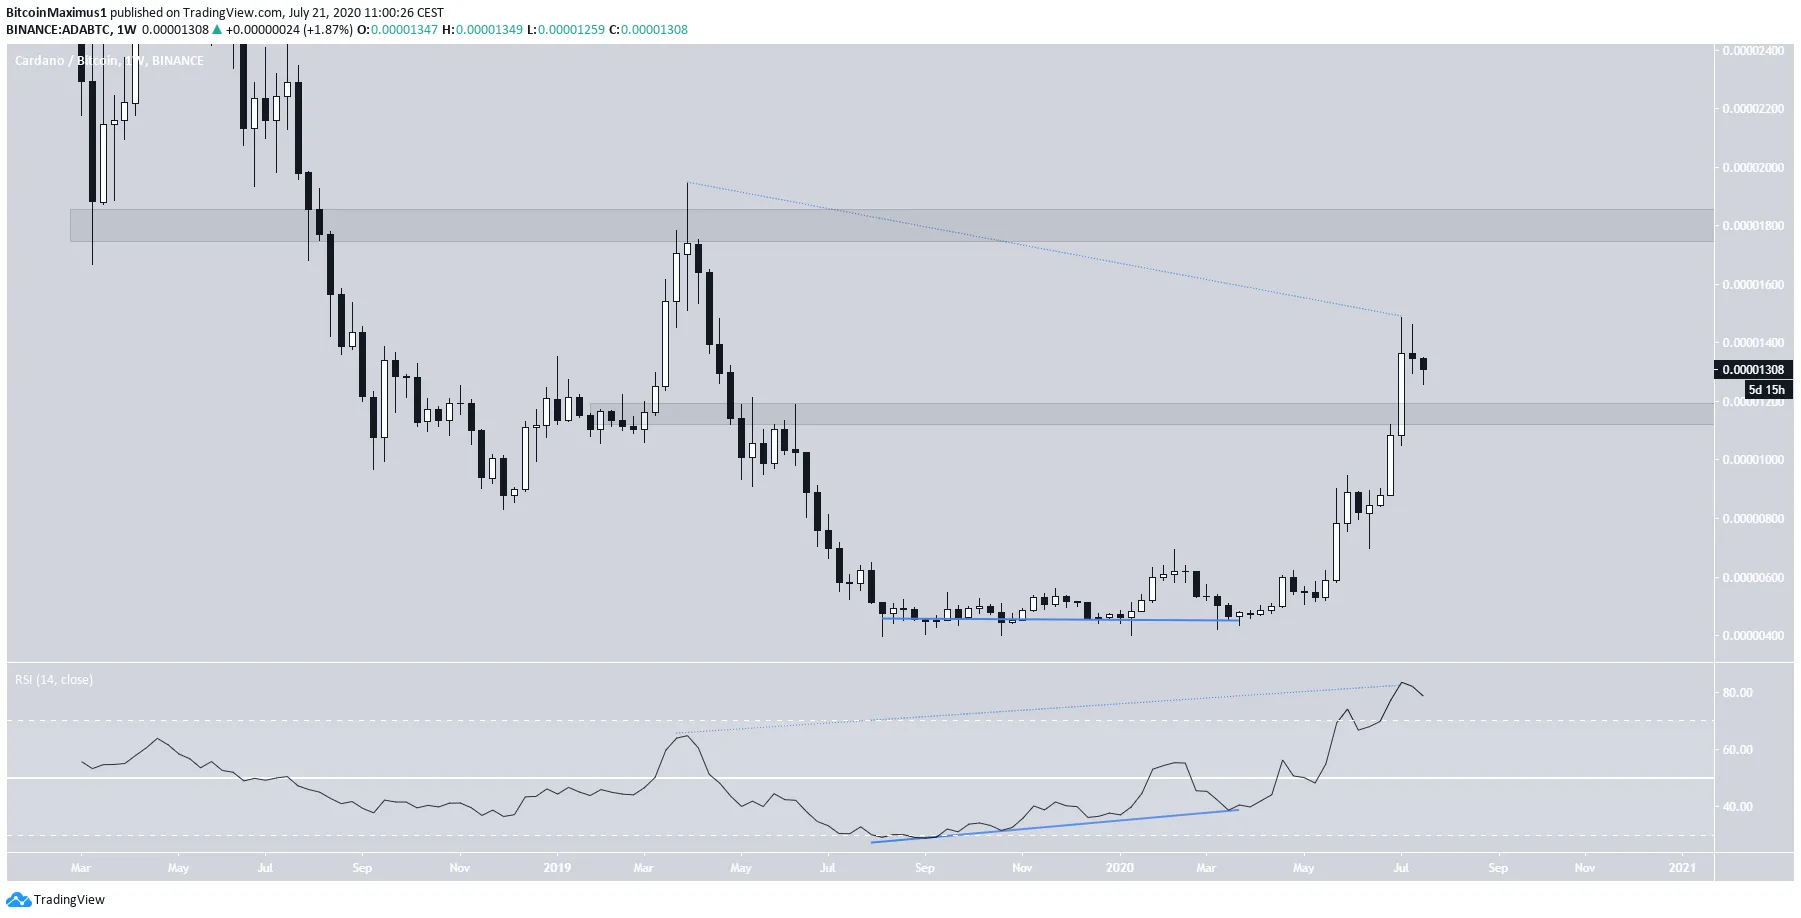 ADA Chart By Tradingview
Cryptocurrency trader @CryptoKaleo stated that ADA could increase to 1900 satoshis, outlining a parabolic movement. This high would fit with our resistance area.
 Source: Twitter
Possible Double Top
ADA’s daily chart is showing several interesting signs. First, a bullish cross has taken place between the 50 and 200-day moving averages (MA), a sign that the trend is bullish. In addition, the move since the beginning of June is clearly impulsive since ADA has broken out from two parallel ascending channels. However, the trend has also begun to show weakness in the form of a double top pattern. There is also bearish divergence on the daily time-frame. If the price begins a corrective period, which seems likely, it could correct all the way to the 0.5 – 0.618 Fib levels at 880 – 1000 satoshis. Alternatively, it could correct shallower, reaching the previously mentioned support at 1200 satoshis, which would also coincide with the 50-day MA.
ADA Chart By Tradingview
Wave Count
A close look at the price action since April reveals that the price has likely begun a five-wave Elliott formation. The impulse had an extended third wave, so it’s currently in the corrective fourth wave. Since the second corrective wave declined all the way to the 0.618 Fib level, it would make sense for the fourth one to complete at the 0.382 level, giving us the shallow retracement discussed in the previous section. Afterward, it will likely continue rising, completing the fifth wave.
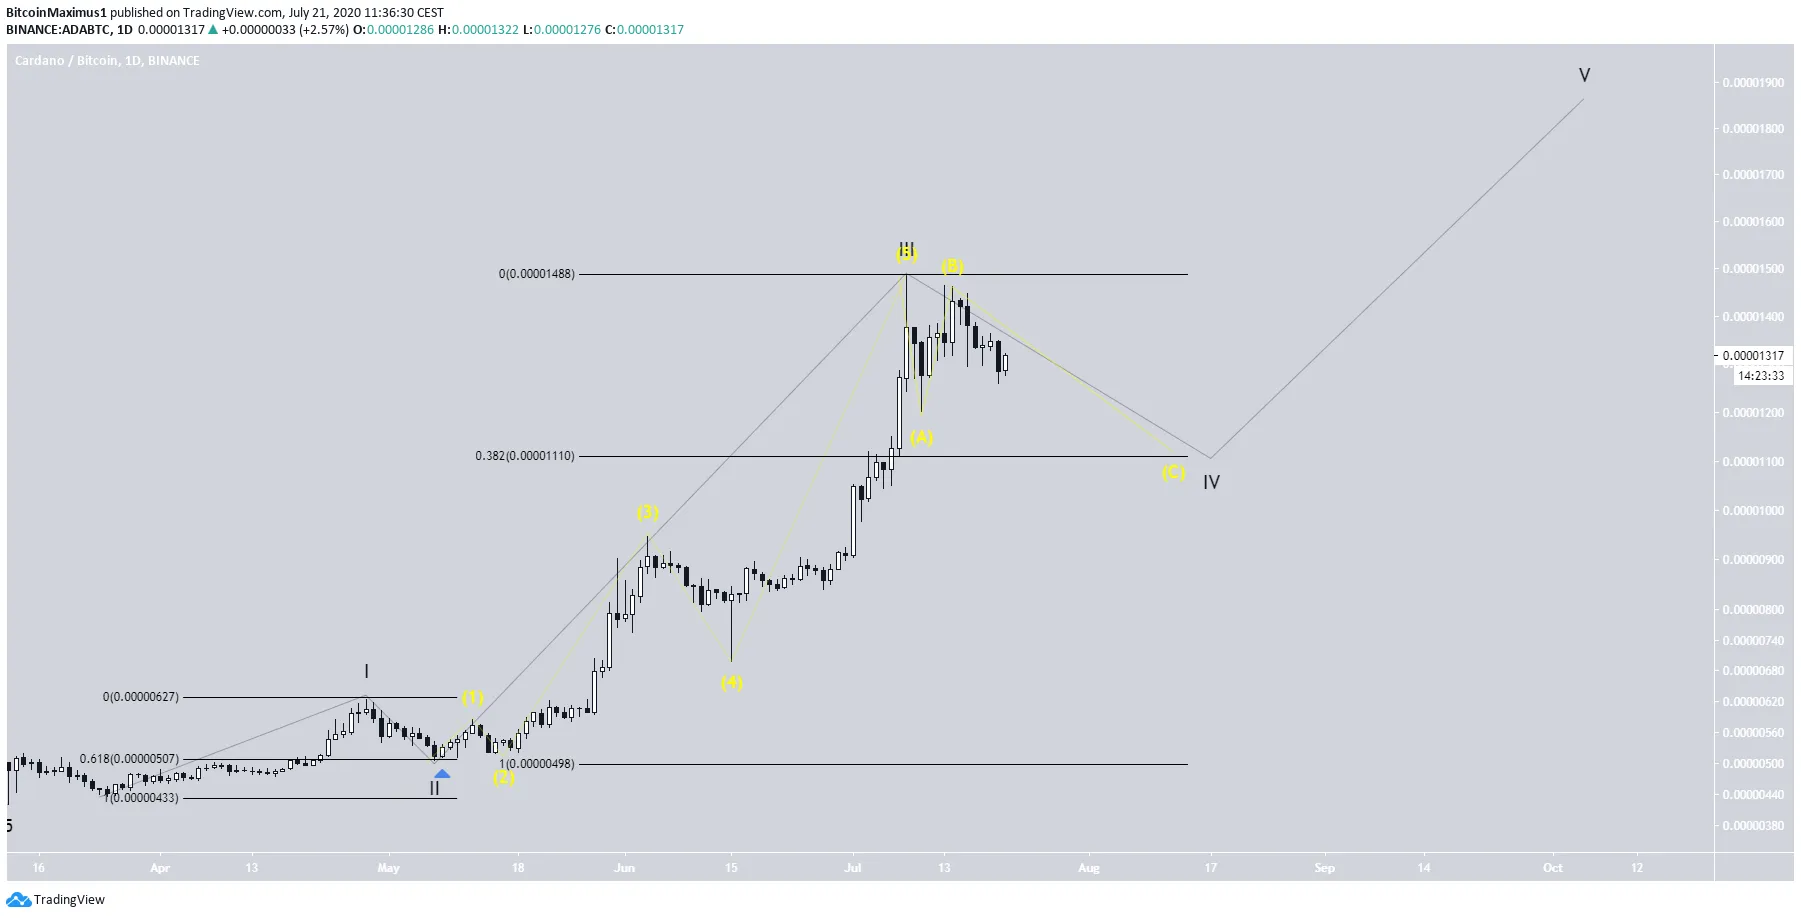 ADA Chart By Tradingview
A look at the hourly chart shows a possible A-B-C extended flat correction. If the C wave travels the entire length of the A wave, it would end near 1160 satoshis, fitting with both our targets from the previous sections.
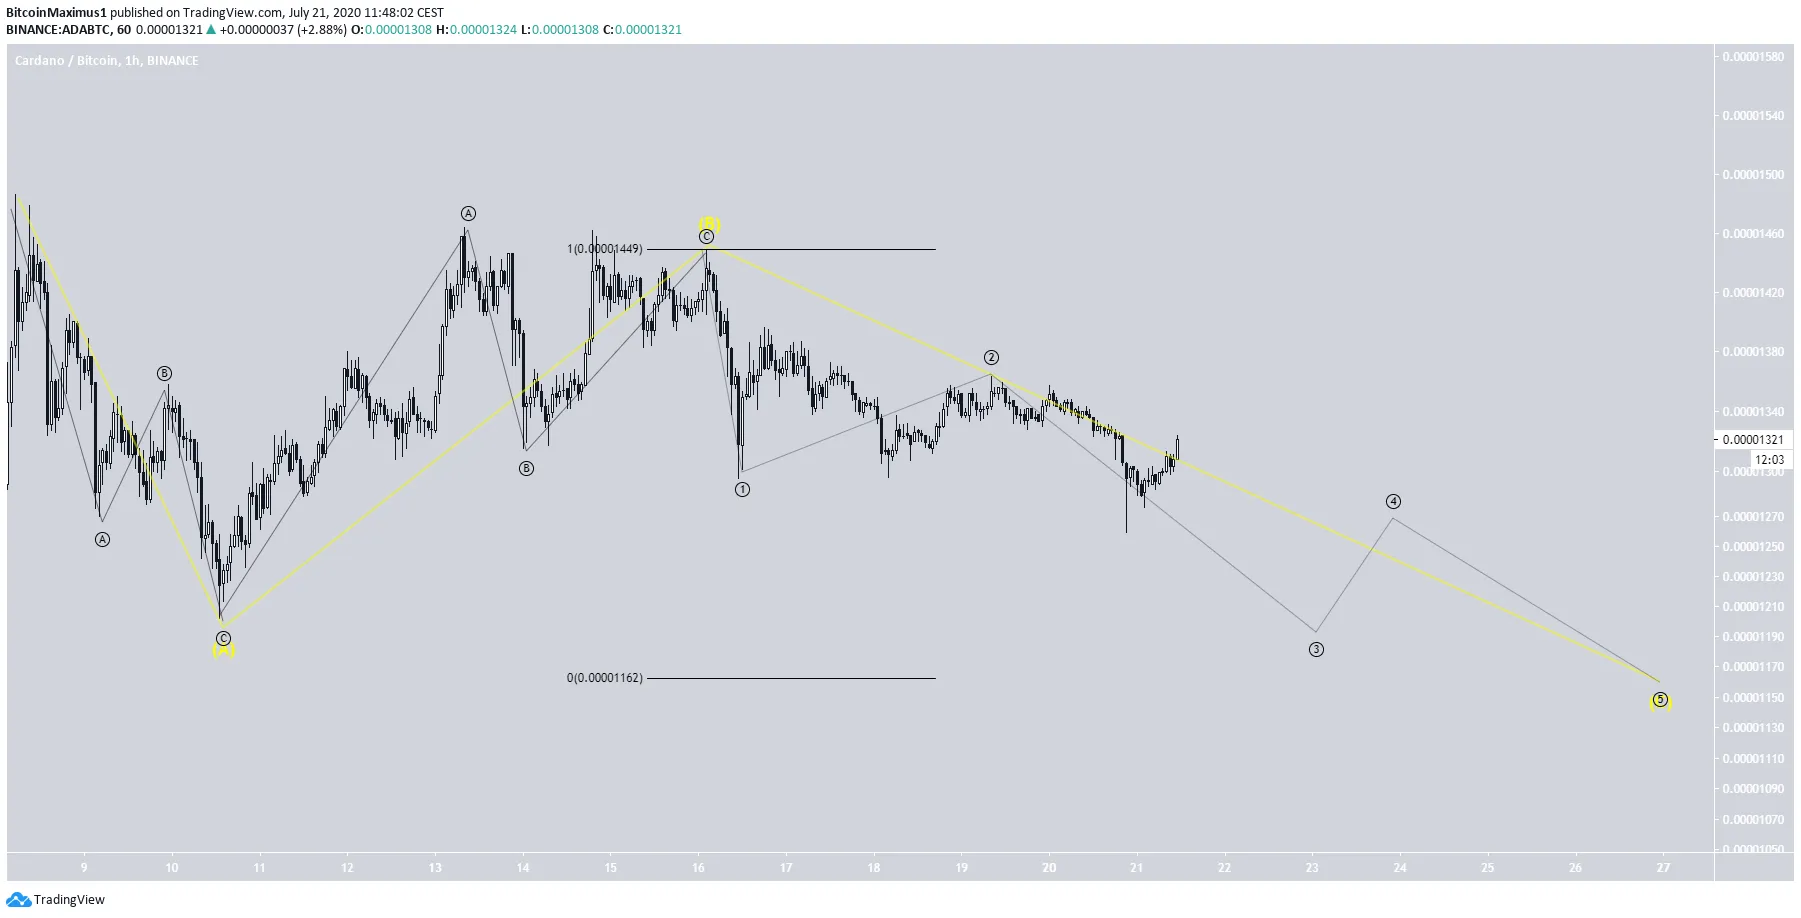 ADA Chart By Tradingview
To conclude, the ADA price is currently in a corrective period, which should end near 1160 satoshis. Afterward, the price should resume its upward move.


