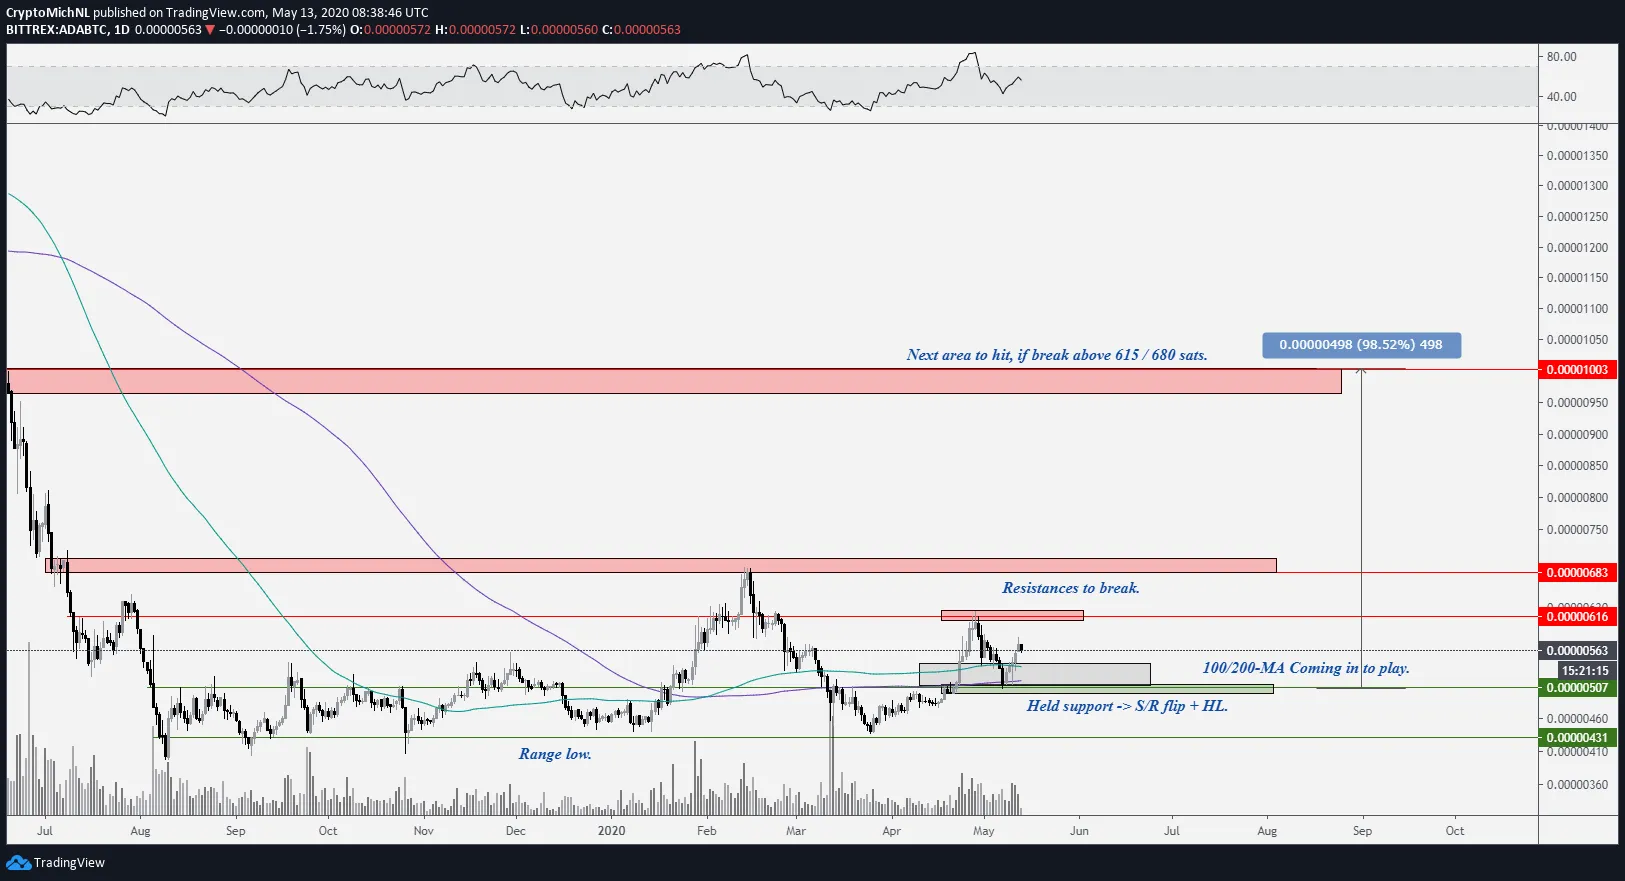
The 200-day MA often acts as support/resistance, depending on if the price is trading above or below it. Several other altcoins have recently moved above their respective MAs, one of which is Cardano (ADA). Well-known crypto trader @CryptoMichNL tweeted an ADA chart that shows that the price has bounced above a strong support area. He has outlined several resistance levels above the current price, the highest of which would amount to a 100% increase from the current price.
 Source : Twitter
Furthermore, he stated that similar movements have transpired in the price of Stellar (XLM) and ZIL:
$ADA #CARDANO A similar one to $ZIL and $XLM. However, lagging behind a little. The 100/200-MA on the daily are coming in to play and that’s an important factor to watch for altcoins. Providing support and range high can be tested. Breaking above 615/680 -> 1000 sats next.
In this article, we will look at the price movement for all three of ADA, XLM and ZIL and determine the similarities between the movement of the three coins.
Cardano (ADA)
The ADA price has increased above and then validated the 540 satoshi level as support. The level also coincided with the 200-day moving average (MA) and an ascending support line that the price had been following for about a month, making it a very significant support level. As for the future movement, if ADA break out above the resistance line it has been following (dashed), it is likely to continue its upward movement towards the next resistance area at 690 satoshis.
Stellar (XLM)
The main support area for XLM is found at 730 satoshis. The price finally validated it as support on May 11 and began to move upwards. This support level is also strengthened by the presence of the 200-day moving average (MA). Furthermore, XLM has also broken out from a long-term descending resistance line, below which it had been trading since July 2019. This is a sign that the price has completed its correction and will begin to move upward. The closest resistance area is found at 910 satoshis.
Ziliqa (ZIL)
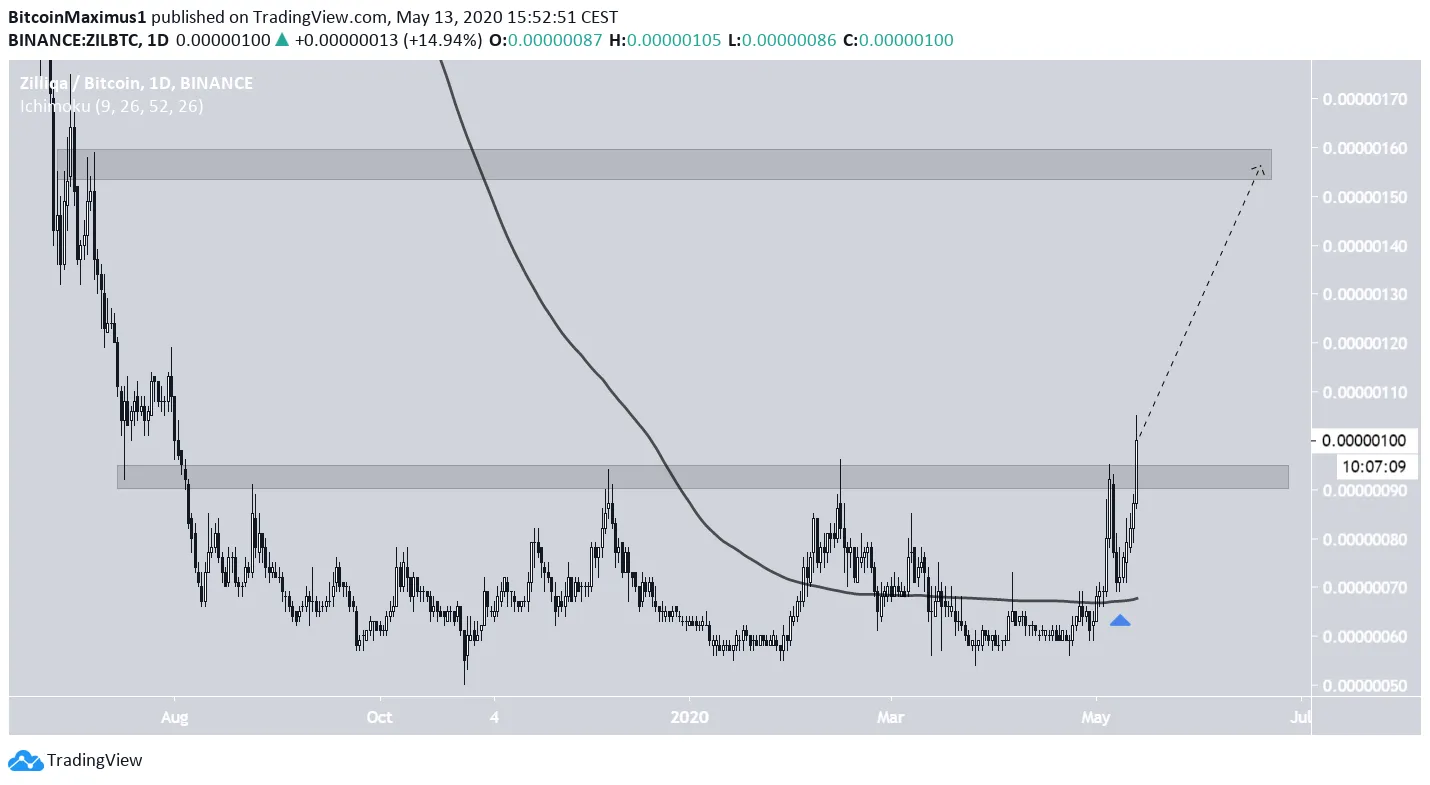
Unlike the other two coins, ZIL has yet to flip its main resistance level as support. In the case of ZIL, this resistance is found at 95 satoshis. While at the time of writing the price was trading above it, it has yet to reach a daily close higher than 95 satoshis. Therefore, the possibility that the price will create a long upper wick and decrease remains. However, ZIL has been increasing at an accelerated rate since it flipped its 200-day MA as support, a sign that the trend is strong.
ZIL Chart By Trading View
If the price successfully reaches a close above this area, the next resistance level would be found at 160 satoshis.


