
A considerable number of altcoins have posted significant increases in the month of January. In lieu of this, we are going to take a look at three coins that have already broken out and have the potential for massive gains in the month of February. These are:
- Litecoin (LTC)
- Cardano (ADA)
- Ocean Protocol (OCEAN)
Without wasting too much time, let’s take a look at each of them and determine their potential for future gains.
OCEAN
The OCEAN price has been gradually increasing along an ascending support line for the past 176 days. On January 16, the price broke out above a descending resistance line. The price has broken out above similar descending resistance lines twice prior, initiating upward moves with a magnitude of 144% and 86%, respectively. If the current move were to have a magnitude of 110% (average of the two prior increases), the price would reach a high of 890 satoshis.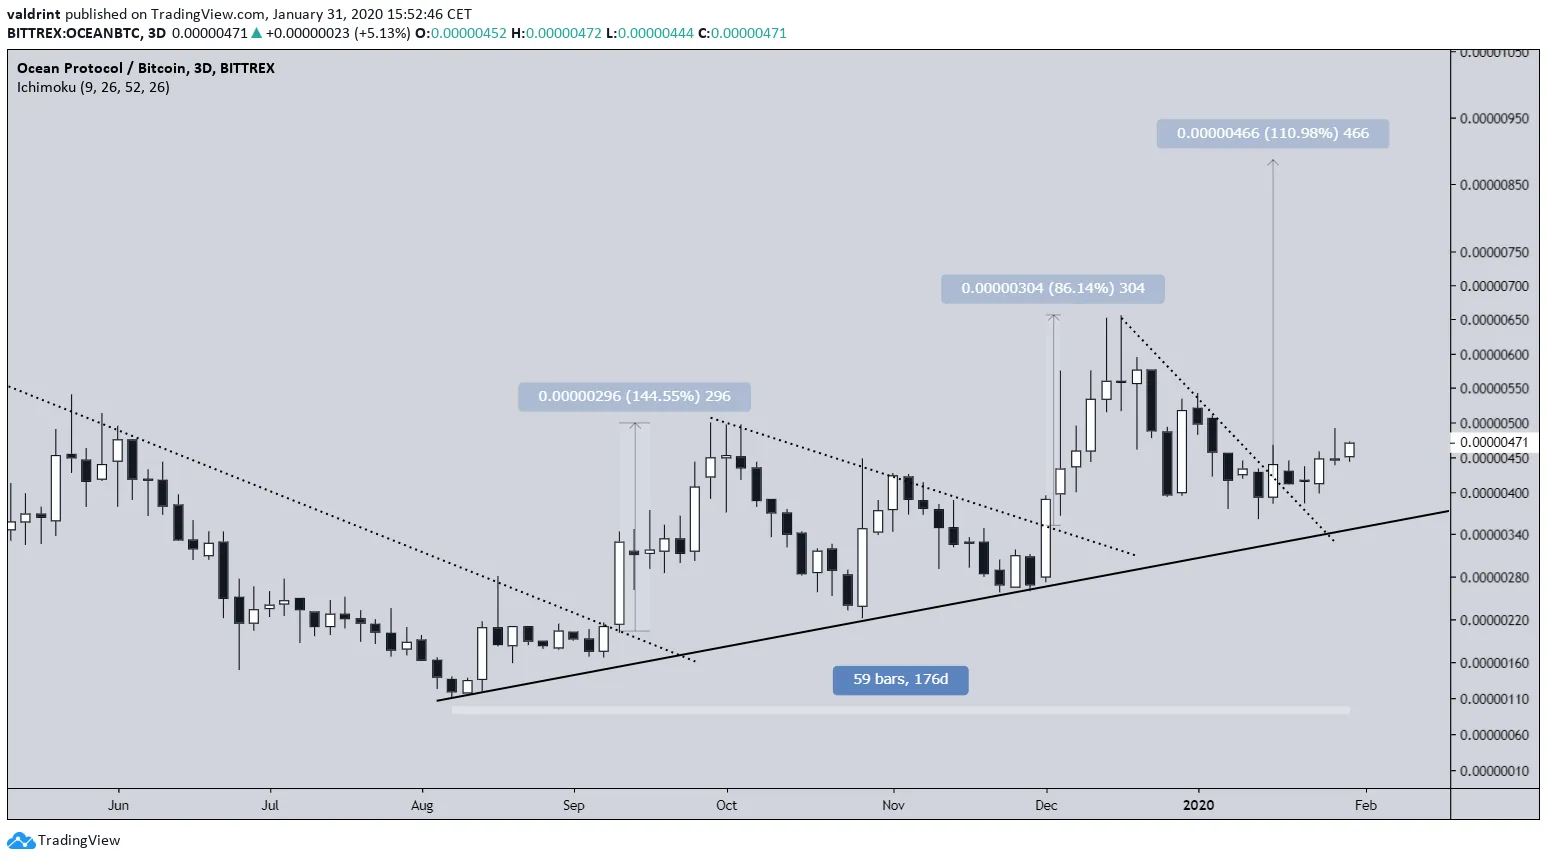 The 3-day RSI supports the aforementioned price increase. During the time the price broke out from the resistance line and validated it as support, the RSI bounced at the 50-line and is currently moving upwards, confirming that the price is in a bullish trend.
OCEAN Conclusions
- OCEAN has broken out above a resistance line.
- The RSI supports upward movement.
- Intermediate target of 640.
- It could reach 840 by the end of February.
Litecoin
The Litecoin price broke out from a long-term descending resistance line on January 14. Afterward, it created a symmetrical triangle, which acted as a continuation pattern and caused another breakout. At the time of writing, the LTC price had created a bullish engulfing candlestick and was in the process of moving above the ₿0.0071 resistance area, heading for the top of the resistance line at ₿0.0078.
Litecoin Conclusions
- Litecoin has broken out above a long-term resistance line.
- The price has moved above its 200-day moving average
- Short-term target of ₿0.0078.
- Long-term target of ₿0.01.
Cardano
The ADA price has been trading inside an ascending triangle since August 2019, validating both the resistance and support lines several times. On January 28, the price broke out from the triangle with very significant volume. It reached a high of 618 satoshis before decreasing slightly. It seems possible that the price will return to validate the resistance line before continuing its upward movement.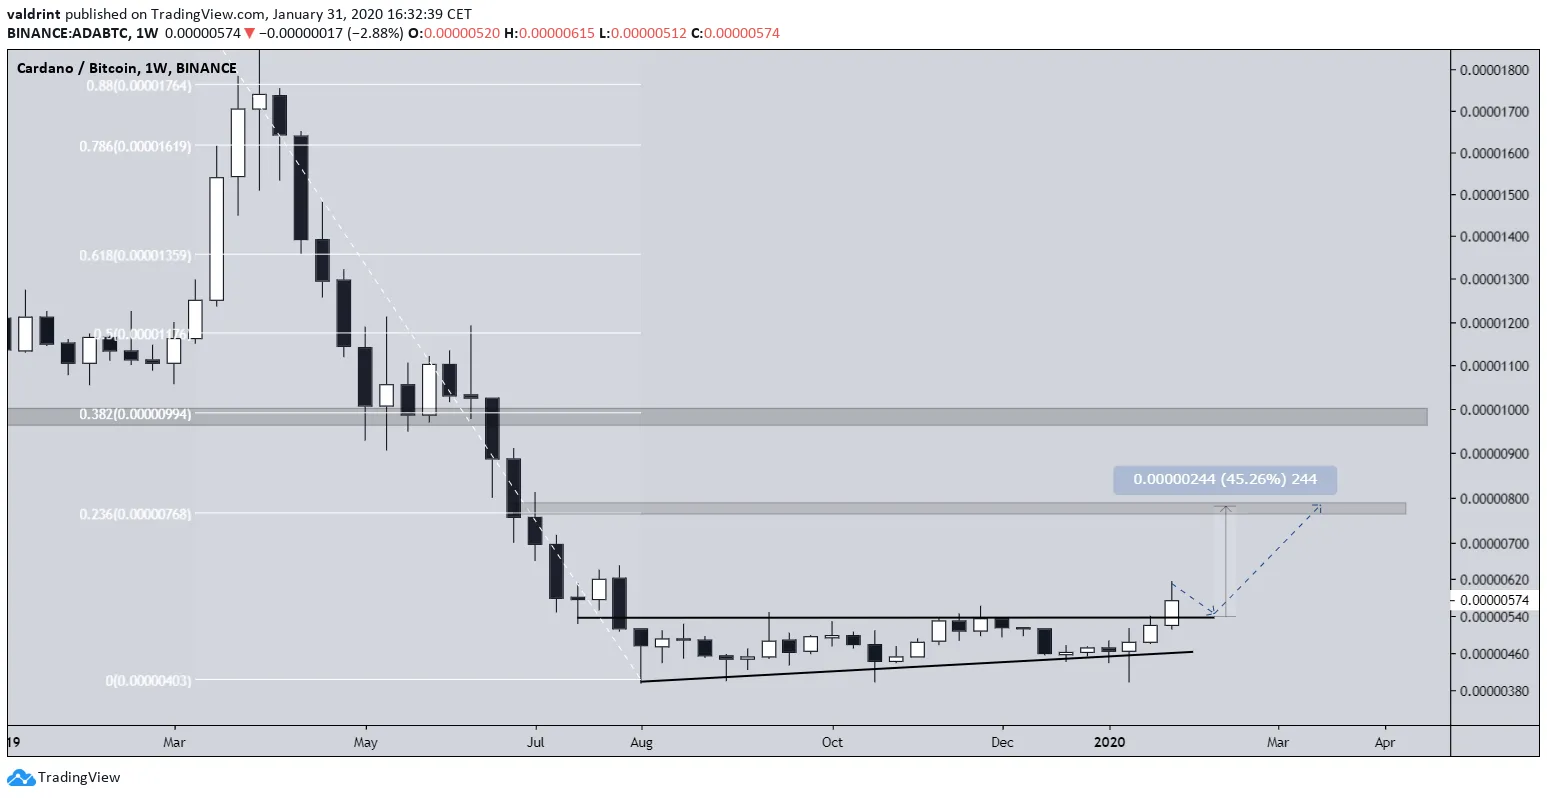
Cardano Conclusions
- ADA broke out from a long-term bullish reversal pattern.
- There is a golden cross about to transpire.
- Short-term target of 780 satoshis.
- Long-term target of 1000 satoshis.


