How would you like to spend less time and money on your event marketing, but still achieve better results and hit your event marketing targets more often?
Who wouldn’t?! And that’s where marketing analytics can help.
Whether you’re running a free or paid for event, using the in-built reports from Eventbrite and basic marketing analytics can really help you refine your marketing strategy and improve the ROI of your marketing campaigns.
Using a free event I ran last year to show you some examples, here are four ways to use Eventbrite reports to enhance your marketing analytics and help you reach your marketing goals while improving efficiency.
1. Page Views

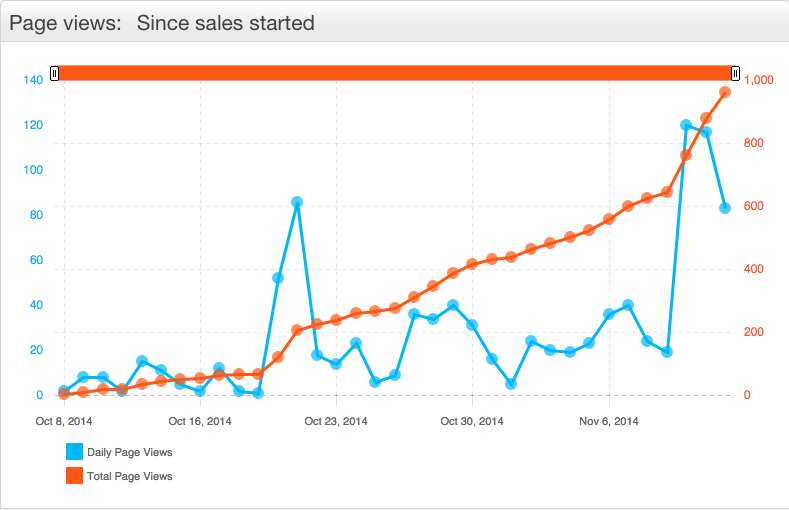
What is the page views report? Page views show you how often you’re event page has been visited.
What can I learn from it? Page views are a great way to check on the overall awareness of your event. If not many people are visiting on your event page, it stand to reason you’re not going to make many sales.
However, combined with other information, they can be more insightful again. For example, if you’ve just published a blog post to promote your event, or sent out a tweet, or if you’ve just launched a paid advertising campaign, you can check to see whether they’ve had an impact by looking to see if there’s been a spike in page views (or not). This then helps you decide how effective that activity actually is.
The Eventbrite report will also tell you when people are visiting your event page (for example do you see consistent peaks on a Monday and troughs on a Saturday or visa versa). This is valuable information too, as it will help you plan when your marketing activities are best to go out (i.e. don’t waste your time pushing your event when your audience is least likely to check it out)
How do I view page views? Simply go to the ‘Manage’ page under ‘My Events’ and in the left-hand column click ‘Charts’ under ‘Analyse’ – page views will be the default chart (more details here).
2. Tickets Sold

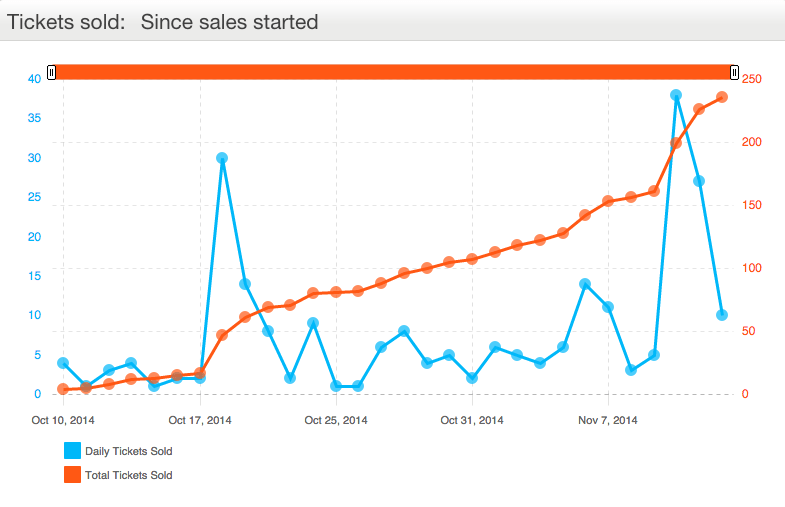
What is the tickets sold report? This is probably self-explanatory! This chart will show you how many tickets you’ve sold (if you have multiple ticket types, they will be amalgamated in this report).
What can I learn from it? Tickets sold will yield you similar insights to page views, with one important difference – all these insights show you actual sales and not just page views, so they’re even more valuable.
The two most important thing to look at in your tickets sold chart is the correlation between activity and sales; and conversion rates.
Firstly, you need to understand whether there is a positive correlation between marketing activities and actual sales. If there isn’t, then you have to reconsider if its worth spending your time or money on such activities.
Second, you should keep a close eye on conversion rates. For example, if you did a paid promotion which saw a big spike in page views, but a low level of ticket sales, this is resulting in a poor conversion rate.
This can tell you two things. Either you’ve managed to reach an audience – but it’s the wrong one for your event – or your event page needs improving.
If you have consistently high page views and low ticket sales (so a poor conversion rate) you should take a serious look at your event page, and consider what is putting people off buying tickets.
Some possible causes could be not including your contact details, an overly short or confusing event description, other lack of information, or potential the price of your tickets are not right.
Learn how to create a winning event pricing strategy here.
How do I view ticket sales? Take the same steps as you would for page views, but select ‘Tickets Sold’ from the drop down menu after you’ve clicked on ‘Charts.’
3. Attendee Geography

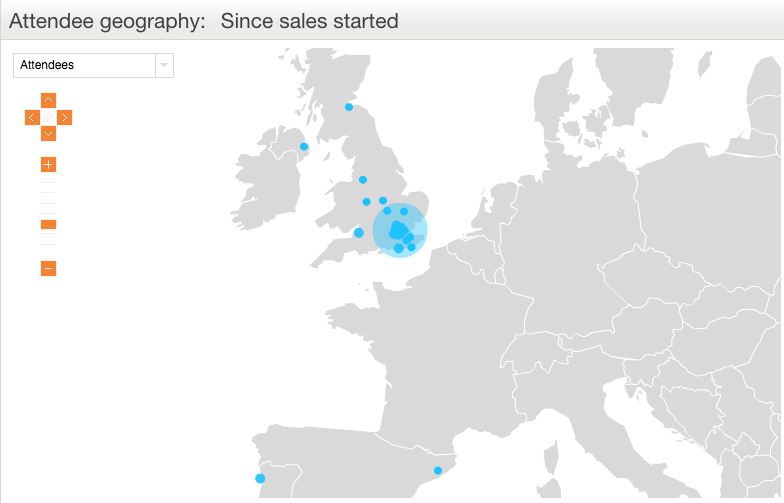
What is the attendee geography report? This is a map that shows you the location of your attendees – from anywhere in the world, so you get a great visual overview of where people are coming from to attend your event.
What can I learn from it? This report is particularly useful for a number of reasons:
- Helps you target and localise your paid marketing. By showing you where a majority of your tickets are being sold, you can then fine tune your marketing campaigns to target those particular locations. Whether you’re distributing flyers or running paid ads on Facebook or Twitter, you now know to geo-target specific areas, and this helps reduce your overall spend while maximising its effectiveness.
- Gives you the right information to evaluate the location of your event. This may be hard to do if you’re half-way into a promotional campaign (though nothing is impossible!) but if you check the map and see that the majority of people are coming from further afield than you though, then you might consider moving venues for your next event. With an easier journey, it might see your numbers increase significantly.
- Lets you look for growth and expansion opportunities. Perhaps you don’t want to change venue, and instead you want to put on a second (or third or fourth) event to satisfy local demand for your event. The report will let you know if there is an appetite for your event in other locations, whether it’s in a neighbouring city or a country half way across the world.
How do I view my attendee’s geography? Take the same steps as above, then select ‘Attendee Geography’ from the drop down menu.
4. Tracking Links

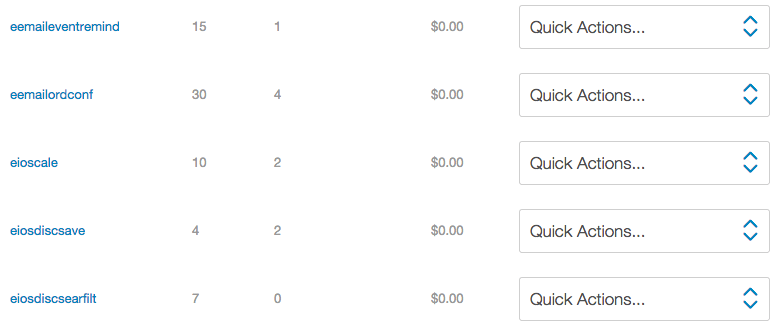
What are tracking links? Eventbrite gives you the option of creating unique tracking links for your events, which show you how many people have come to your event page or bought tickets from clicking that specific link. It’s a great way to seeing, at a granular level, what specific marketing activities are working (or not).
What can I learn from them? Tracking links can yield a near infinite number of insights, depending on how many you create and how you use them. However, here are a few of the most frequently used cases.
- Track the effectiveness of paid promotional campaigns. If you’re paying for any marketing, you should definitely use unique tracking links for each paid promotion, so check which ones work, and which don’t. You can then double-down on the promotions that drive ticket sales, and cut out any unnecessary spending on those that don’t.
- Understand the value of marketing partnerships. By giving each partner a unique tracking link, you can see which of your marketing partners are driving the most page views, ticket sales and conversion rates, letting you know which ones you should work with more (or less) as the campaign progresses.
- Get insights into social media and messaging. If you want to get a better understanding of which messages, and which social media activity, is actually driving ROI, you can use a tracking link for each individual update. While it is a little bit more labour intensive, the insights you gain could save you a lot of time – and help you generate a lot more sales – over the long run.
How do I view my tracking links? This is located in a different place to the other 3 reports. Still in your manage tab, look under ‘Invite and Promote’ and you’ll see ‘Tracking Links.’ Click on this to access all the info you need (for more info on creating tracking links and finding the reports, see this help centre article).
Conclusion
So there you have it! Four concrete, simple to access ways of understanding what is working (and what isn’t) when it comes to your event marketing. With some basic marketing analytics, these Eventbrite reports should really help you improve your ROI and see even more success in the future.
How have you used Eventbrite’s reports to provide more insight for your events? Share your experience below!


