
Fear of home break in, home invasion, home burglary—whatever you call it—is common for homeowners and renters alike. And it’s for good reason. Though rates are steadily decreasing, a burglary occurs every thirty seconds in the United States. And burglary victims experience more than property loss, as physical, mental, and emotional health often suffers after victimization.
Included in this article are some of the most enlightening (and in some cases, shocking) home burglary statistics we could find. Many statistics come from the U.S. Department of Justice Bureau of Justice Statistics and FBI Uniform Crime Reporting data. But a wide range of sources was used to give a full picture.
Don’t be surprised if it inspires you to rethink your home insurance protection for break ins and theft!
Table of contents
- How Common Are Home Break Ins?
- What Are the Average Costs of a Home Break In?
- Emotional and Physical Effects Statistics of a Home Break In
- Time Statistics on When Home Break Ins Occur
- Location of Home Break in Statistics
- Home Break In Statistics on Renters vs. Owners
- Trends for Home Break Ins
- Statistics on Those Committing Home Break Ins
- Data on Methods to Prevent Home Break Ins
- Frequently Asked Questions: Home Break Ins
- Methodology & Sources
How Common Are Home Break Ins?
Crime statistics show that home burglaries are common, though not the most common form of property crime in the United States. The good news is that the number of home burglaries have been on a steady decline since the early 1990s.
-
In 2019 in the United States, a burglary occurs every 30 seconds. That’s two burglaries every minute or 3,000 burglaries every day. (FBI)
-
From 2003 to 2007, there were 3.7 million burglaries on average in the U.S. each year. That was 10,137 burglaries a day. So despite a recent uptick in some areas, burglaries are on the decline overall. (BJS)
-
Of the estimated 2.5 million burglaries per year, 65% of burglaries are home break-ins. (FBI)
-
In 2018, 7.2% of homes were affected by property crimes. (FBI)
-
Over the next two decades, 75% of homes will be burgled. (BJS)
-
Home break ins are more common in the South than in any other region. (FBI)

What Are the Average Costs of a Home Break In?
The average loss from a home burglary costs more than $2,500 for victims. How much one might cost you depends on the value of your personal belongings. Always be sure that your home insurance coverage limits accurately reflect the replacement cost of your items.
-
The average American suffers $2,661 in losses from a single burglary. (FBI)
-
The average homeowners claim for theft is $4,391. (III)
-
In 2019, burglaries accounted for more than $3 billion in losses. (FBI)
-
The most commonly stolen items are cash, electronics, gold, jewelry, and medications. (University of North Carolina, Charlotte)
-
Half of the people affected by a burglary said that irreplaceable or sentimental items were stolen or damaged during a home break-in. (SafeWise)
-
Physical damage to homes is very common as 95% of home break-ins involve forceful entry to the home. (BJS)
-
Property crimes overall accounted for more than $15 billion in losses in 2017. (FBI)
Compare Home Insurance Quotes Instantly
Enter your ZIP codeGet my quotesEmotional and Physical Effects Statistics of a Home Break In
Property damage isn’t the only loss homeowners suffer after a home break-in. Most victims report suffering mentally and emotionally.
-
Someone is home during nearly 30% of home burglaries. (FBI)
-
Of the people who interrupt a home break-in, more than 25% become the victim of a violent crime. (BJS)
-
Of all burglaries, a person is injured around 7% of the time. (BJS
-
67% of victims report that their emotional and mental health was affected by a home break in. (SafeWise)
-
63% of victims report having trouble sleeping after experiencing a home break in. (SafeWise)
-
35% of victims report depression and anxiety occurring after a home break in. (Victim Support)
-
26 % of victims report feeling fearful after a home break in. (Victim Support)
-
60% of people reported that they are most concerned about a home break in occurring while they’re not at home. (SafeWise)
-
58% of people report that they’re afraid of a home break in occurring while they’re sleeping. (SafeWise)

Time Statistics on When Home Break Ins Occur
While many might assume that most home break ins occur at night, they’d be wrong. Daylight hours are the preferred time for most burglars as it lowers the probability of someone being at home.
-
Most burglaries occur between noon and 4 p.m. (SafeWise)
-
Burglaries occur between 6 a.m. and 6 p.m. 65% of the time. (FBI)
-
Burglaries that occur during the day reduce the chance of someone being home. (BJS)
-
Burglaries occur between 6 p.m. and 10 p.m. 17% of the time (BJS)
Time of Year
-
Burglaries are more common in the summer months— rising 10% in frequency between June and August. (BJS)
-
July and August are the most common months for home break ins. (NCJRS)
-
Of 700 respondents to a survey, June was the most popular month for home break ins, followed by March and April. (SafeWise)
-
Burglaries decrease in frequency by 11% during the winter. (BJS)
-
February has the fewest instances of home break ins on average. (BJS)
Average Time Involved in a Home Break In
-
The average burglary lasts between eight and ten minutes. (Alarms.org)
-
On average, it takes a minute or less for a burglar to enter a home. (SecureAlert)
Burglaries occur every 30 seconds in the U.S. More burglaries occur in the summer than at other times of the year. 65% of burglaries occur during the day when people are less likely to be home. The average burglary lasts between eight and ten minutes.
Location of Home Break in Statistics
While large cities like Chicago, New York, and Los Angeles tend to have a bad reputation for crime, more burglaries occur in the South by far. Perhaps even more surprising is that the rate of burglary overall (home, auto, and other) is more common in the suburbs than in the city.
-
More home burglaries occur in New Mexico than any other state with 697 burglaries per 100,000 people. (Statista)
-
New Mexico is followed by Oklahoma, Mississippi, Arkansas, Louisiana, and South Carolina respectively. (Statista)
-
New York and California are at the bottom of the list. (Statista)
-
In New York, there are just 142 burglaries per 100,000 people. (Statista)
-
In California, there are 386 burglaries per 100,000 people. (Neighborhood Scout)
-
Burglaries, in general, occur most often in the suburbs with 670.7 burglaries per 100,000 inhabitants. In metropolitan areas, there are 544.8 burglaries per 100,000 inhabitants. And in rural areas, there are 432.1 burglaries per 100,000 inhabitants. (NCJRS)
-
Burglaries of households occur most often in cities — 111.7 in 1,000 households— followed by rural areas where there are 25.4 household burglaries per 1,000 households. Suburbs have the fewest number of household burglaries with 17 per 1,000 households. (NCJRS)
-
Warmer weather even during winter months correlated with more frequent burglaries in Chicago. (Crimes of Opportunity or Crimes of Emotion)
-
Large cities have seen the greatest decline in burglaries— 5.9% in recent years. (Federation of American Scientists)
-
In New York City, burglaries in the first week of March 2021 have decreased by 9.4% compared to the same period in 2020. (NYPD)
-
More burglaries occur in the South than any other region with 44.6% of all burglaries. (FBI)
-
The West and Midwest regions are second and third most popular with 27.4% and 19.2% of all burglaries, respectively. (FBI)
-
The Northeast region has by far the lowest occurrence of burglaries with only 8.8% of all burglaries occurring there. (FBI)
-
Burglaries declined in every region in 2019— 8.4% in the South, 9.4% in the West, 10.3% in the Midwest, and 13.5% in the Northeast. The national average of burglary decline was 9.9%. (FBI)

Home Break In Statistics on Renters vs. Owners
While single-family homes are more targeted than apartments, renters experience a higher number of burglaries than homeowners.
-
Renters are more likely to experience a home break in than homeowners. (BJS)
-
There were 33 burglaries per 1,000 renters and 18 per 100,000 homeowners in the U.S. in 2011. That’s a steady increase from the crime peak in 1994 where there were 68 burglaries per 1,000 renters and 44 per 1,000 homeowners.
-
Single-family homes are significantly more likely to be targeted by a home break in than apartments. (BJS)
-
Single-family homes provide more entry points for burglars to break in. (NCJRS)
-
More than 65% of burglaries affect residential properties. (FBI)
Trends for Home Break Ins
Home invasion statistics have changed a lot over the last thirty years. Though the number of home break ins is decreasing overall, some states have actually seen a rise in recent years. And they’re not the states you’re thinking of.
-
Across the U.S., burglaries have declined by 69% from 1993 to 2019. (Pew Research)
-
Burglaries occur at just one-fifth the rate of occurrence in 1980. (Disaster Center)
-
While property crime overall is declining, instances of property crime is increasing in five states: Alaska, North Dakota, Montana, South Dakota, and Colorado. (SafeHome)
-
Property crime has seen the greatest decrease in Vermont, Massachusetts, Maine, New Hampshire, and Michigan. (SafeHome)
-
Burglaries involve forced entry around 56% of the time from 2017 to 2019. However, the occurrence of forced entry burglary has decreased from 1,401,840 in 2017 to 1,117,696 in 2019. (FBI)
-
Despite headlines, burglaries in Chicago in 2021 continue to show a decline year over year. (Chicago Police Department)
-
So far in 2021, burglaries have decreased by 12.8% compared to the same period last year. (NCBI)
Justice Trends
-
Of all reported burglaries, only 13% end in an arrest. (Pew Research)
-
In 2019, 171,590 people were arrested for burglary. (Office of Juvenile Justice and Delinquency Prevention)
-
Burglaries deemed misdemeanors typically result in less than one year of jail time. (NOLO)
-
Felonious burglaries typically result in more than one year of jail time. (NOLO)
-
Virginia has some of the harshest penalties for home burglary. Class 2 and 3 felonies can result in 25 years to life in prison depending on the nature of the crime. (NOLO)
-
In Texas, the maximum penalty for burglary is 99 years. (NOLO)
Trends About the Crime
-
The master bedroom is the first place most burglars check for valuables. (Safe at Last)
-
In 2018, roughly 7% of home burglary also included robbery (theft from a person). (BJS)
-
A serious injury occurs in 9% of all burglaries where a person is home. (BJS)
-
A minor injury occurs in 36% of burglaries where a person is home. (BJS)
-
Just 12% of burglars break in armed with a firearm. (BJS)
-
A little over half of the homes burglarized will be targeted again within six weeks. (ReoLink)
-
Many burglars look for homes with window air conditioning units. (Connecticut Post)
-
Burglars also look for piled-up mail. (Baltimore County Police Department)
-
One in 25 burglars enters through an unlocked door. (FBI)
-
One in 8 burglars picks a lock. (BJS)
-
The back door is the point of entry in 22% of burglary cases. (FBI)
-
Second-floor entry occurs in just 2% of burglaries. (Burglary Prevention Council)
-
The garage door is the point of entry in 9% of burglaries. (FBI)
-
The basement is the point of entry in 9% of burglary cases. (FBI)
-
81% of home break ins occur on the first floor. (FBI)
-
Windows are the point of entry in 23% of burglaries. (FBI)
-
Most home break ins are impulse decisions— planned burglaries occur only 12% of the time. (FBI)
-
Poorer households are more likely to be burgled. (BJS)

Statistics on Those Committing Home Break Ins
Most burglars are under the age of 25. However, burglaries committed by older people have been on the rise in recent years.
-
While it’s commonly thought that most burglars, 65%, know their victims, this is misleading. In a majority of cases, the burglar’s identity was never established, and so it cannot be said for certain whether the burglar knew the victim. (BJS)
-
Non-professionals commit most burglaries— 85%. (BJS)
-
Most burglars are male and under the age of 25. (BJS)
-
Burglars between the ages of 36 and 50 are the second most common age group. And burglaries from this age group are on the rise. (BJS)
-
Female burglars are uncommon. (BJS)
-
Most burglars target homes within a few miles of their own residence. (FBI)
Data on Methods to Prevent Home Break Ins
Many Americans do nothing or very little to prevent home break ins despite the fact that potential burglars are often deterred by signs of a home security system. People who have experienced a home break in do take action to prevent another one. Our recommendation is to do what you can to ensure you don’t make your home an easy target.
-
About 17% of Americans use a home security system. (National Council for Home Safety and Security)
-
About 40% of Americans do nothing to prevent home break ins. (SafeWise)
-
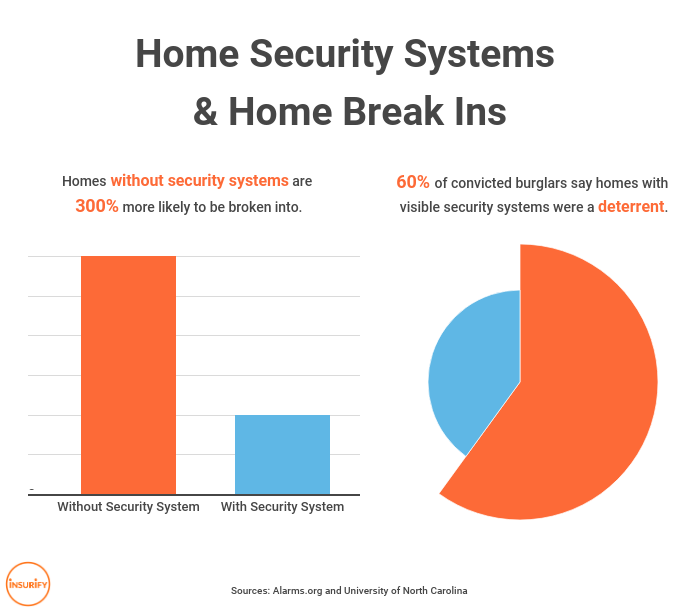
Homes without security systems are 300% more likely to be broken into. (Alarms.org)
-
60% of convicted burglars said that homes with visible security systems were a deterrent. Visible elements included stickers and yard signs. (University of North Carolina)
-
Peace of mind is the primary reason for 60% of people who purchase a home security system. (J.D. Power)
-
People are happy with their home security system, with 95% of users reporting satisfaction. (J.D. Power)
-
Just 27% of home security system users arm their system before going to bed. (J.D. Power)
-
More than half of people who own a home security system don’t know how to use it. (J.D. Power)
-
56% of home security systems use a touch panel inside the home. (Safe at Last)
-
Mobile devices are preferred to control a home security system by around 40% of users. (Pew Research)
-
After a home break-in, 49% of people change their locks/deadbolts, 41% add home alarm systems, and 38% install security cameras. (SafeWise)
-
ADT is the most popular home security system in the U.S. with over 7.2 million users. Vivint comes in second, and Brinks comes in third. (Statista)
-
An audible alarm is the reason behind 72% of failed home break ins. (Statista)
-
The best methods for self-protection include installing a home security system, installing security cameras, installing upgraded locks, tending to your yard, having a neighbor collect your mail when you’re out of town, keeping travel plans off social media until you’re home, and getting proper homeowners insurance. (SafeWise)
-
Two-thirds of home break in victims pull a weapon during the burglary, but a gun is fired only 8% of the time. (BJS)
Frequently Asked Questions: Home Break Ins
-
What time are most home break-ins?
Most break ins occur between 6 a.m. and 6 p.m. Burglars choose daylight hours because it lowers the chances of someone being home.
-
How many homes get broken into each year?
Around 2.5 million homes are broken into every year. That number has been on a steady decline since 1993.
-
What are the best ways to protect your home from burglary?
Installing a home security system or other theft-prevention devices is the best way to deter burglars. Beyond this, keeping your yard, locks, and windows well maintained is also a good way to deter burglars.
As most burglars strike when people are not home, you should have a neighbor collect your mail when you’re out of town. You should also avoid posting about any travel plans until after you’ve traveled out of town.
Methodology & Sources
Statistics from the following institutions were incorporated onto this page: the FBI, the Bureau of Justice Statistics, the NCJRS, the SafeWise, the University of North Carolina, Charlotte, SecureAlert, Alarms.org, Statista, Neighborhood Scout, Crimes of Opportunity or Crimes of Emotion, the Federation of American Scientists, the NYPD, Pew Research, Disaster Center, SafeHome, the Chicago Police Department, NCBI, III, the Office of Juvenile Justice and Delinquency Prevention, NOLO, Safe at Last, ReoLink, the Connecticut Post, the Baltimore County Police Department, the Burglary Prevention Council, the National Council for Home Safety and Security, and J.D. Power.
Data Attribution: The information, statistics, and data visualizations on this page are free to use; we simply ask that you attribute any full or partial use to Insurify through a link to this page.


