
If you have an event website, you can’t afford to ignore SEO (or Search Engine Optimisation). Setting up your site to be search engine-friendly ensures that people can find your event when they do a web search.
But once you’ve optimised your event website, how do you know your efforts are paying off?
Measuring your site’s search optimisation is mission critical to continued SEO success. Luckily Google Analytics provides a number of metrics and reports to help you monitor your event website’s performance. Let’s look at how you can use Google Analytics to monitor your success – and identify areas that need improvement.
Note: If your events are on Eventbrite and you want to add Google Analytics to your events, follow the instructions in this help article to start tracking visitors to your event listing. And if you’re not familiar with Google Analytics, don’t fret. Google’s Analytics Academy is a free way to learn the fundamentals of web analytics so you can become an SEO all star.
Monitor Organic Search Traffic
When you’re busy planning your event, finding time to dig into your analytics can be tough. Luckily there’s a way to keep tabs on your organic (or unpaid) search traffic and monitor its overall health.
In the left-hand panel, go to Acquisition > All Traffic > Channels.

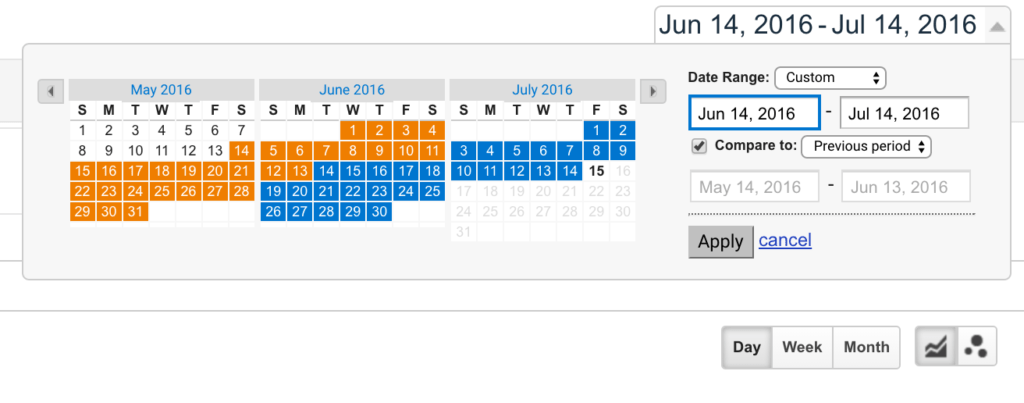
The ‘Channels’ report breaks down where your traffic is coming from. What percentage of visitors are finding your site through organic search versus a social media post or a paid search ad? If you’ve been investing in SEO, you’ll want to know which channels are driving your traffic – and how that traffic is growing or shrinking over time. To do that, use the date selection tool at the top of the page to compare, and check the “Compare to” box. From there, you can use “Previous period” for month-over-month and year-over-year trends, or choose a custom date range to compare.
Analyse Landing Pages
Visitors don’t always arrive at your event website through your homepage – especially if they enter through a web search. Knowing how they enter your website – and where they go from there – provides a more accurate picture of their purchase journey.
To find how which pages your visitors see first, go to Behavior > Site Content > Landing Pages.
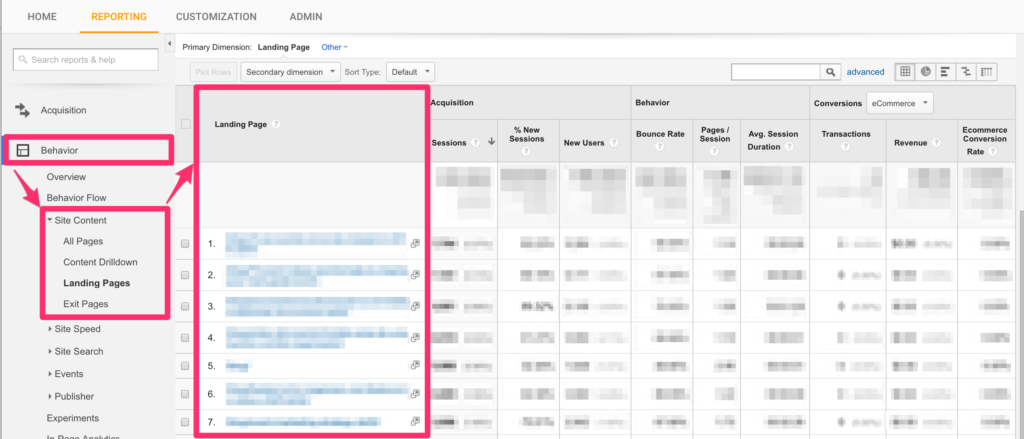
This report provides a view of the top landing pages, regardless of where they came from. To filter out referrals from other websites, email, and social media, you’ll have to use segments.
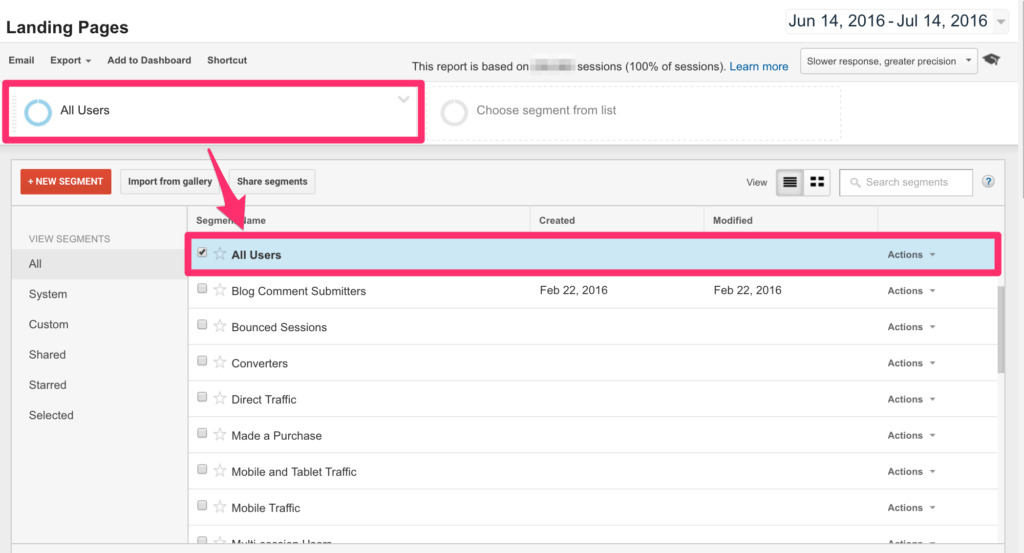
To see your available segments, go to the top of the report, and click on ‘All Users’.
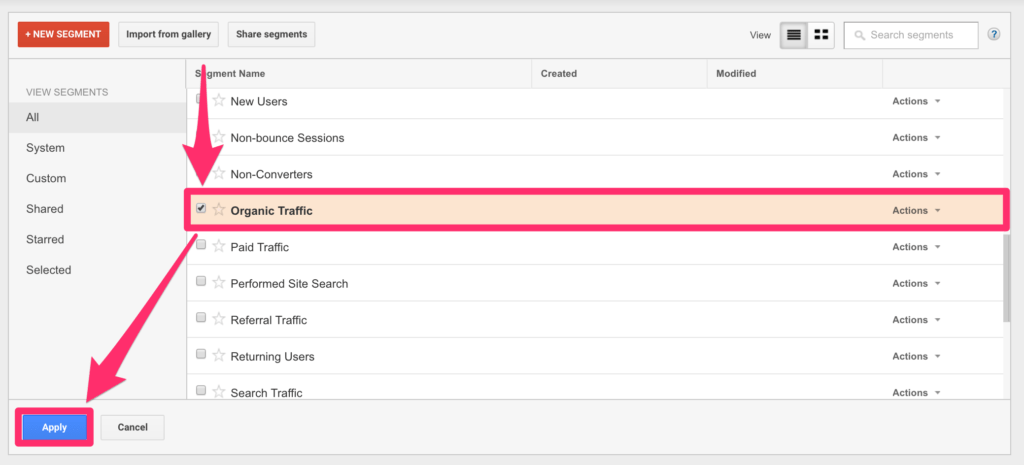
A list of available segments will appear. Uncheck the box for ‘All Users,’ scroll down to check the box next to ‘Organic Traffic,’ then hit ‘Apply.’ Now the ‘Landing Page’ report will only show the pages people found through organic search.
Now analyse the pages driving the most traffic to your event website. Is the content on the page providing the most up-to-date information on a particular keyword or topic? If the top-performing page is a past event, that’s your cue to add an announcement for your upcoming event – and include a link to buy tickets or register.
Measure the Quality of Search Traffic
When it comes to your bottom line, organic search traffic is just the beginning. You still want to know if those visitors are converting into ticket holders and registrants.
When looking at your analytics, there are three metrics critical to SEO – and your sales. Let’s look at each and find out what they mean.
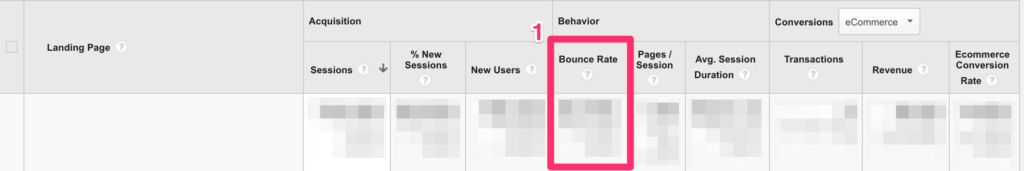
1. Bounce Rate
A bounce rate is the percentage of traffic that left your site after viewing only a single page. Often, a high bounce rate is a sign that the information that enticed people to click through to your site doesn’t match what’s on the page.
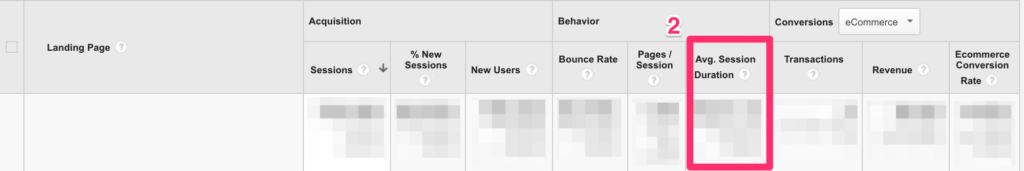
2. Average Session Duration
With this metric, you can determine how long a visitor stays on your event website. Longer sessions indicate that they’re engaged with the content you’re sharing. Compare the ‘Average Session Duration’ of visitors coming from ‘Organic Search’ to those who were referred by ‘Paid Search’ or ‘Social’. The results can tell you which channels are driving the most engagement – and may be worth doubling down on.

3. Pages/Session
Like ‘Average Session Duration’, ‘Pages/Session’ is an indicator of engagement. This one measures how many pages someone visited after landing on your website. Used in conjunction with the ‘Landing Pages’ report, you can determine which pages are keeping visitors engaged. You can also look at the ‘Channel’ report to compare ‘Organic Search’ traffic to other referrers.
With these metrics, you’ll have a firm grasp on what pages are engaging visitors and identify those that aren’t. More engaged visitors drive organic search rankings and, in turn, convert more visitors into ticket holders and registrants.
Tracking and analysing your SEO performance is an important step to getting your event website in front of more people. For more advice on how to optimise your site for search, download the SEO Cheat Sheet for Events.


