Bitcoin has resumed its affinity for the upside after the slight retracement last week and relative uncertainty earlier this week. That uncertainty was caused as the market eagerly anticipated inflation data which turned out softer than anticipated.
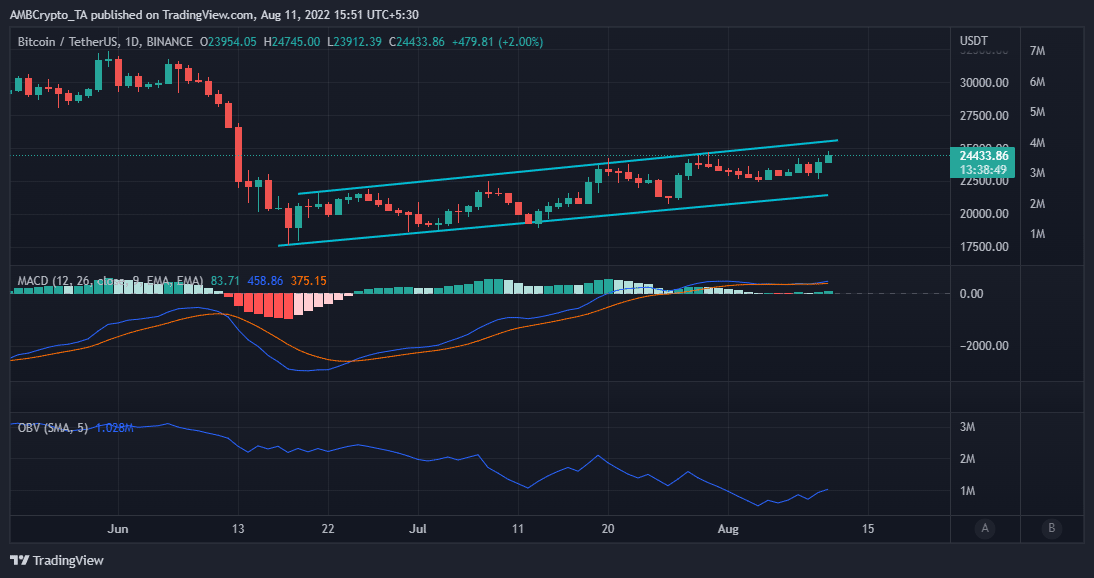
The lower inflation data boosted investors’ sentiment. Hence, encouraging an overall bullish outlook. Bitcoin managed to rally by roughly 6.9% in the last two days and traded at $24,433 at press time.
Its price action in the last few weeks provides a rough idea of where the price is headed.
Bitcoin’s ascending channel has so far restricted the price within a support and resistance zone.

Source: TradingView
Is there a breakout potential?
BTC holders should note that the bullish momentum has notably reduced according to the MACD. This is in comparison to previous rallies within the current range, especially in July.
However, the number of addresses holding at least one Bitcoin has steadily increased in the last two weeks. If it maintains the same pace, then BTC might just have enough momentum for a breakout.
Source: Glassnode
On the other hand, the number of addresses buying might taper out as the price approaches the resistance line. Another healthy indicator to watch is the Purpose Bitcoin ETF Holdings metric.
This ETF has been buying during the rallies and duping a lot of BTC during the dips. Thus, contributing heavily to the price action.
For example, the Purpose Bitcoin ETF metric registered an increase from 24,898 BTC on 9 August to 26.079 BTC the next day. This aligns with the resulting bullish Bitcoin price action during this period.
Source: Glassnode
Some outflows from this metric will likely be observed as the price approaches the resistance line. This is assuming there will be enough sell pressure.
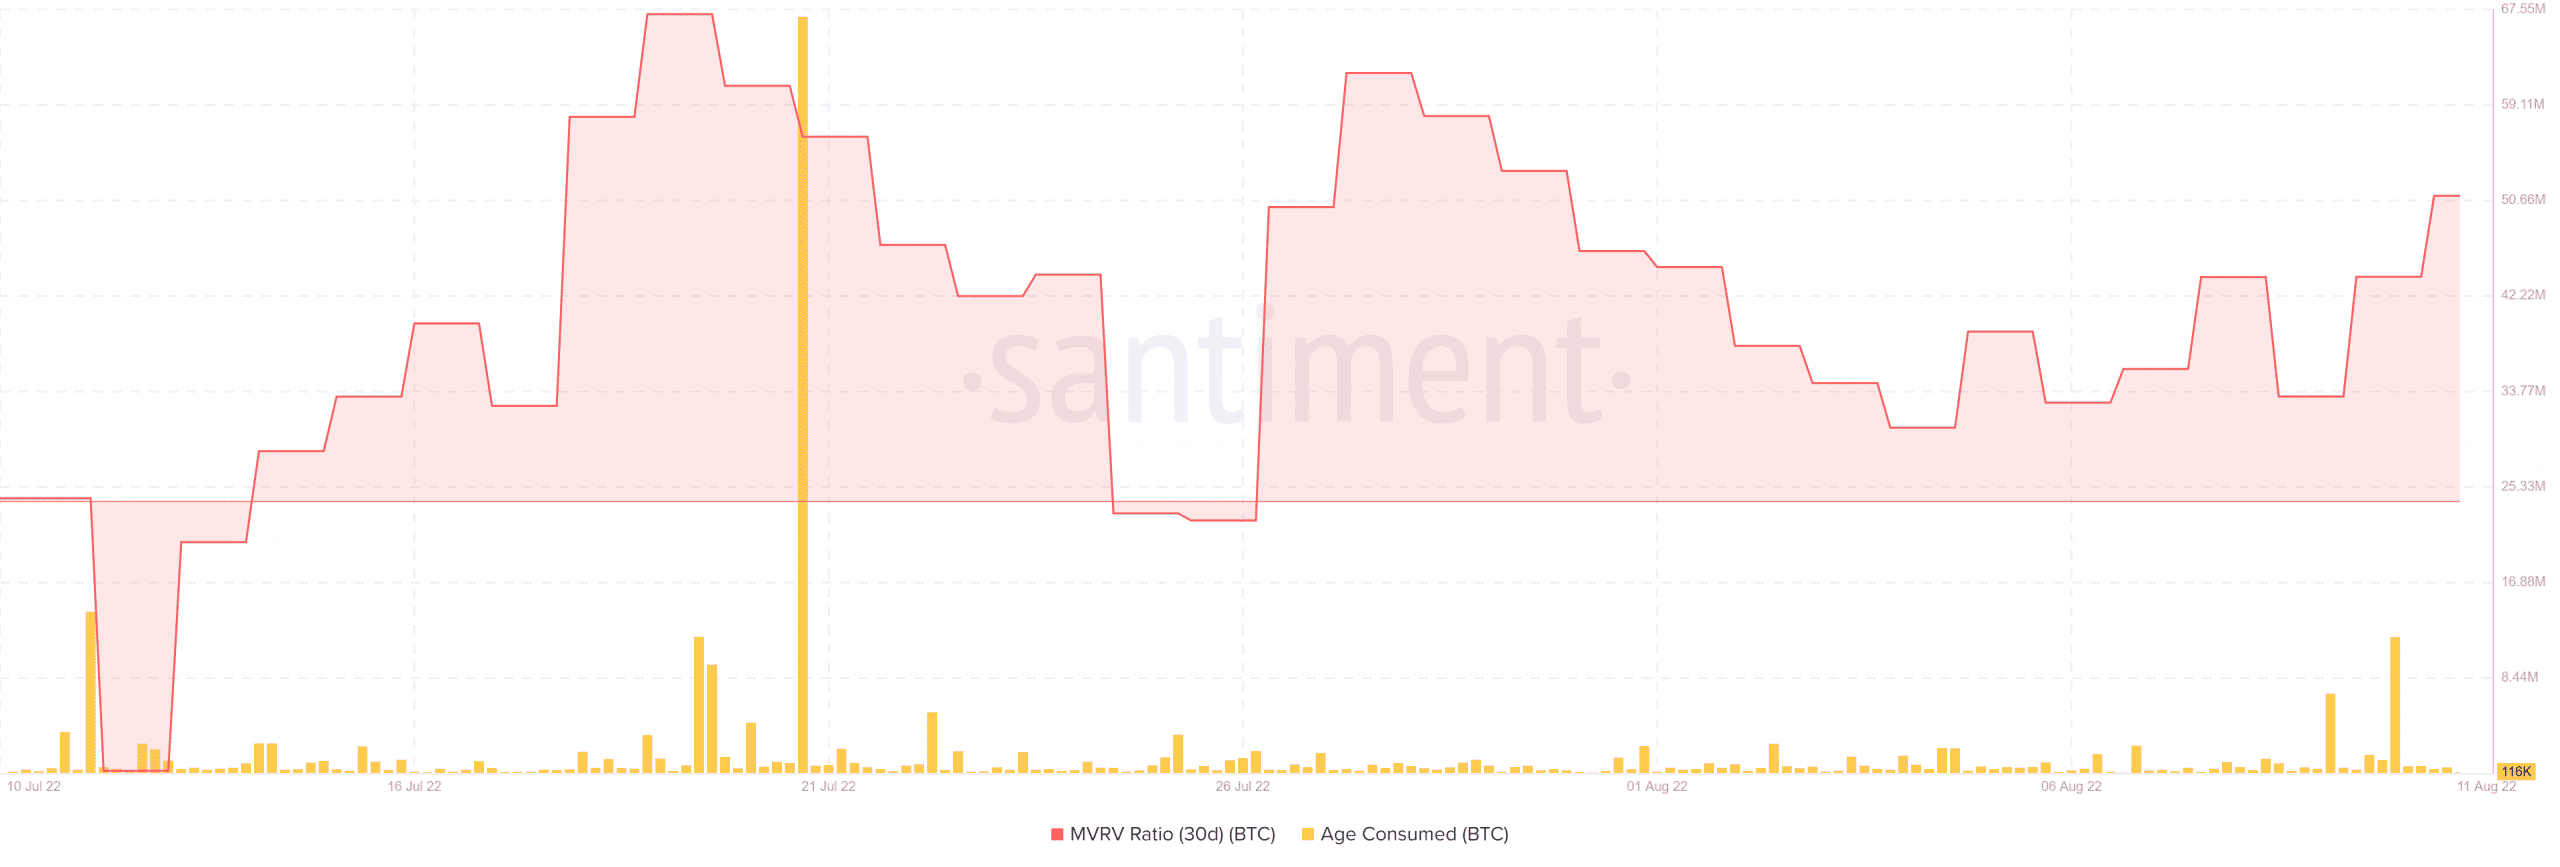
Moreover, Bitcoin’s latest uptick was supported by strong accumulation. Roughly 12.05 million BTC changed hands according to BTC’s age consumed metric on Santiment. A higher MVRV ratio was a consequence of the upside, and more traders in profit mean a sell-off is waiting to happen.

Source: Santiment
Bitcoin might deliver yet another retracement after the next resistance line retest. However, investors should keep in mind that the MACD indicates that the current trend might not last for long.


