Over the past couple of days, previously stablecoin-hugging traders and investors have deployed capital and entered the crypto markets with some confidence. Evidence for this was present on the Tether Dominance chart which fell from 8.27% on Monday to stand at 7.94% at press time.
Read Fantom’s [FTM] Price Prediction 2023-24
This indicated buying pressure could have appeared over the past two days. Fantom rallied after a drop to $0.223 and showed signs of moving back toward $0.26 and $0.289. With Bitcoin also able to break above $17.8k, a few bullish days could be ahead.
The confluence between Point of Control and inefficiency meant bulls had the upper hand

Source: FTM/USDT on TradingView
From 28 November to 2 December, Fantom rallied from $0.185 to $0.255. This represented gains of around 37%. In doing so, FTM left behind an inefficiency on the 12-hour chart. Highlighted in white, this FVG has already been visited, and the price climbed higher swiftly.
The FVG also has confluence with the Volume Profile Visible Range’s Point of Control, which lay at $0.228. The lower timeframe bullish market structure break that occurred on 13 December when FTM broke above $0.242 also reinforced the bullish position.
On lower timeframes, the $0.238-$0.242 has been an important zone. A retest of the same in search of liquidity can offer traders with a good risk-to-reward buying opportunity.
The RSI showed momentum remained bullish but has weakened over the past two weeks. At the same time, the price has formed lower highs, hence this fall off on momentum was understandable. So long as FTM can keep itself above the $0.222 mark, its bullish bias would be preserved. Meanwhile, the OBV has been flat in December.
Any buyers in the vicinity of $0.24 can look to take profit at the Value Area High at $0.257 (which is also a local resistance) and the $0.289 resistance levels.
Open Interest picked up drastically in late November and traders remain bullish

Source: Coinalyze
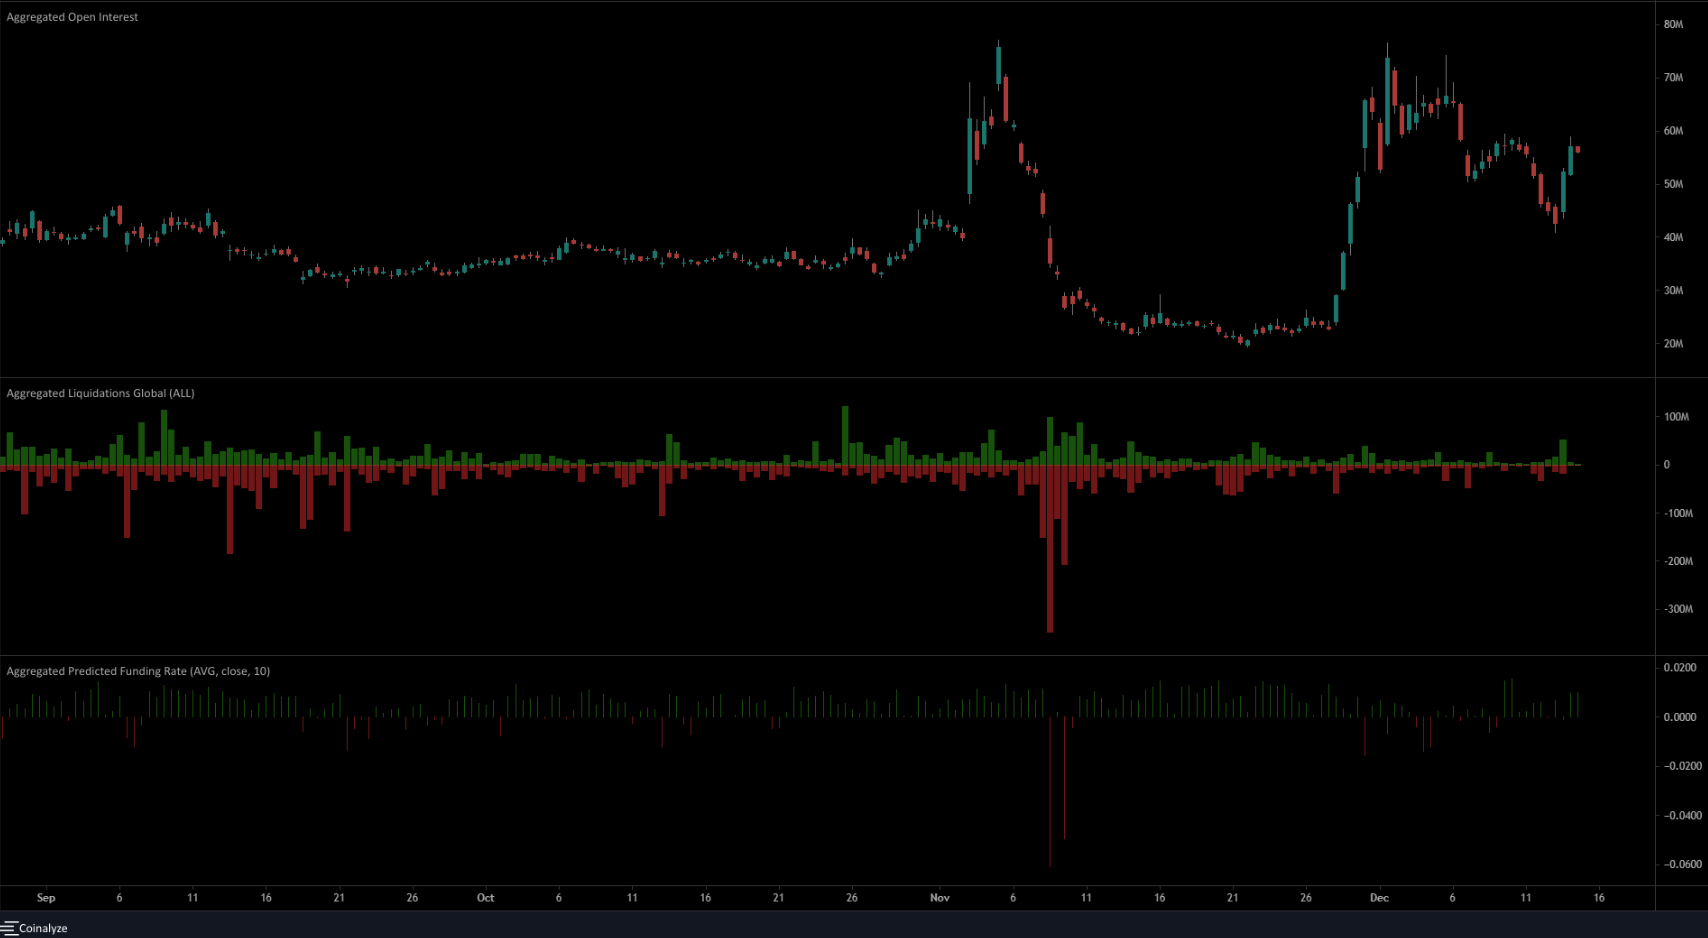
During FTM’s quick rally late in November, the Open Interest saw a huge move upward. Just before this rally, it had been flat near the $23 million mark, but it surged to almost $72 million just a few days thereafter. This showed a strong bullish conviction behind the rally.
The sweep of the FVG was accompanied by a fall in OI. These indicated bulls were likely being forced to close at a loss. However, the funding rate has been positive in recent days and showed traders remained bullishly positioned.
If FTM can move back above $0.255, and the OI also perks up, it would be a firm indication of bullish intent.


