SushiSwap [SUSHI] has been upsetting investors for quite some time now thanks to its negative price action. CoinMarketCap’s data revealed that SUSHI registered 12% negative weekly losses and was trading at $1.18 at press time, with a market capitalization of over $150 million.
However, investors might hear some good news soon. This can be said because some metrics and market indicators revealed the possibility of a trend reversal.
Read SushiSwap’s [SUSHI] Price Prediction 2023-2024
Is a trend reversal inevitable?
CryptoQuant’s data revealed that SUSHI’s stochastic was in an oversold position. This could be considered as a massive bullish indicator.
Additionally, according to CryptoMiso’s chart, SUSHI ranked second in terms of the most active cryptos based on GitHub commitments in the last three months. This revealed that developers were putting their best foot forward to enhance the network further.
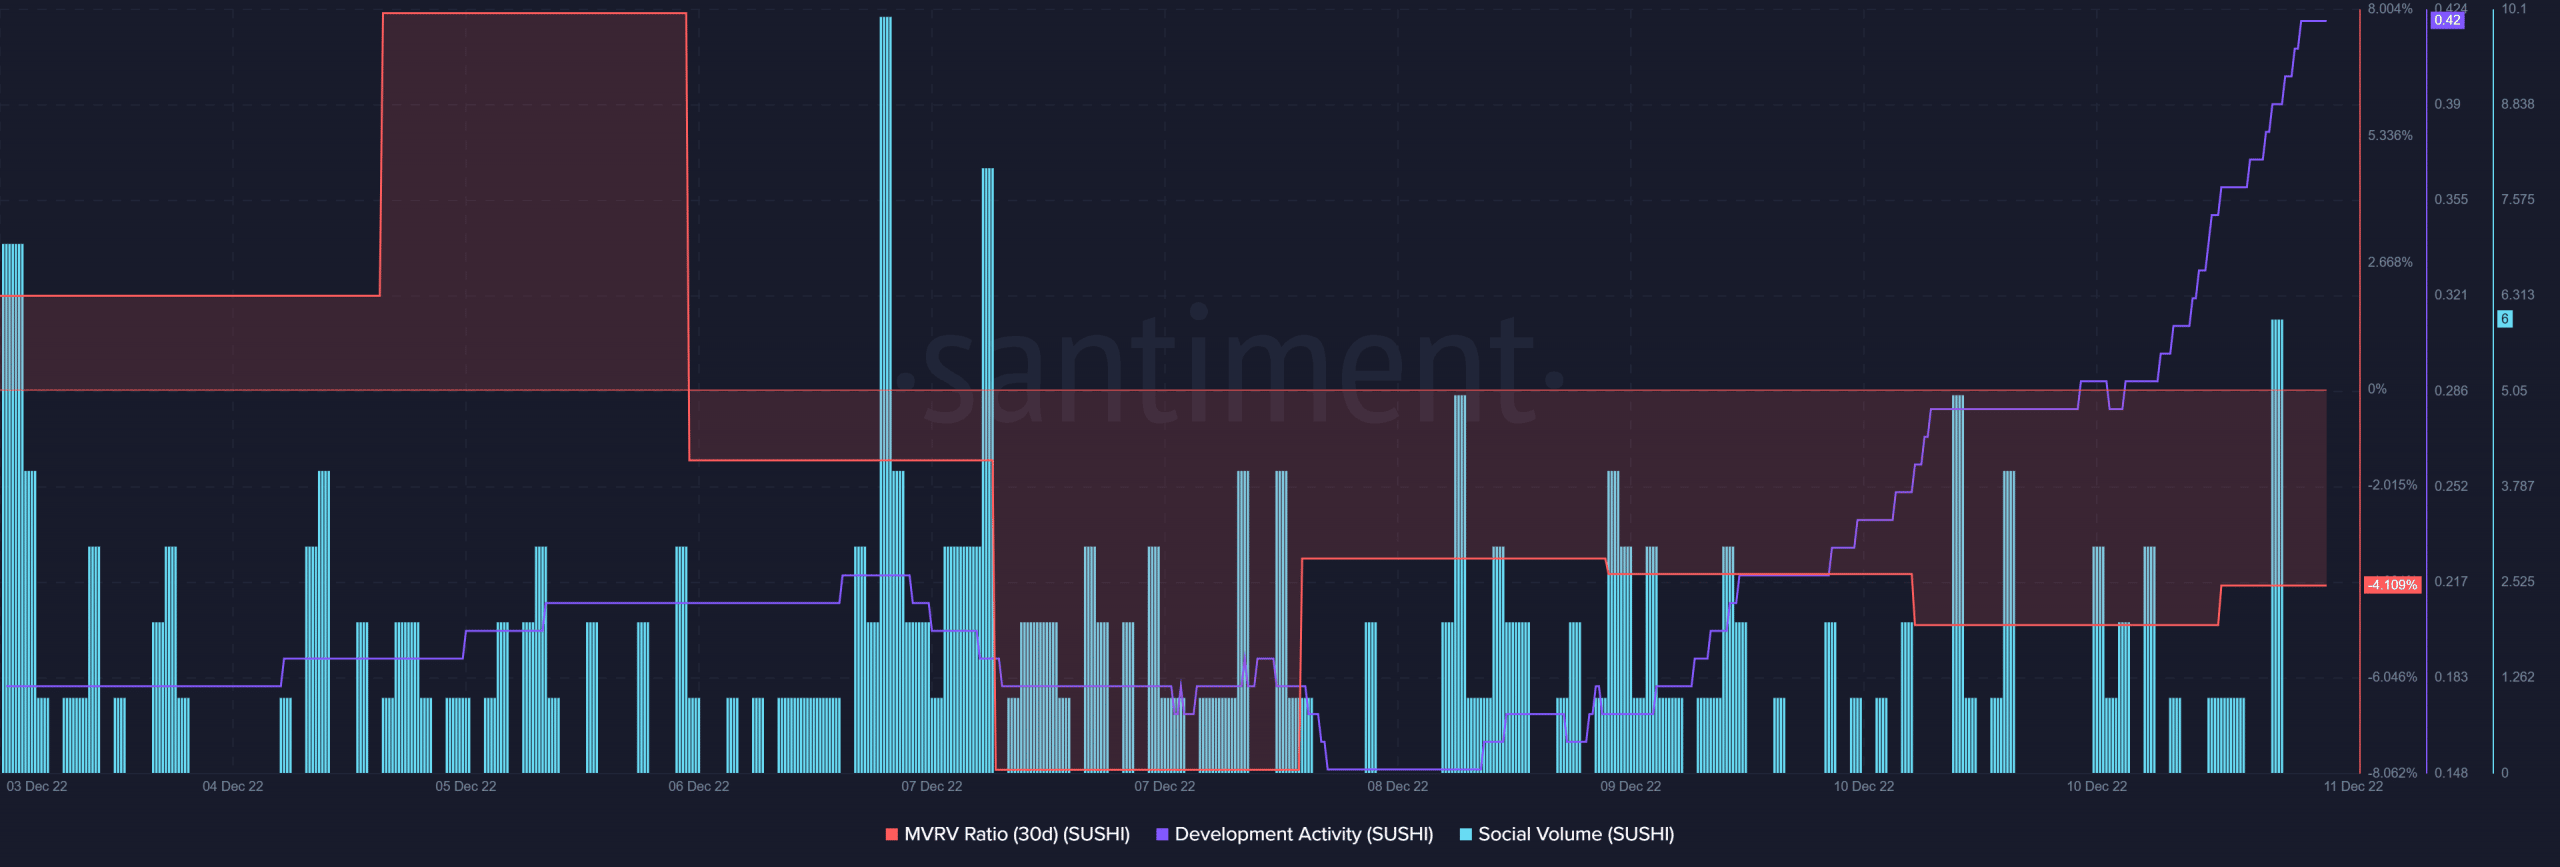
Santiment’s data provided further hope as several on-chain metrics supported a trend reversal. For instance, SUSHI’s Market Value to Realized Value (MVRV) Ratio registered a slight uptick. This looked promising for the token.
Furthermore, SUSHI’s development activity also witnessed a sharp surge. The token also remained quite popular in the crypto industry, as its social volume spiked last week.

Source: Santiment
Should SUSHI investors be concerned?
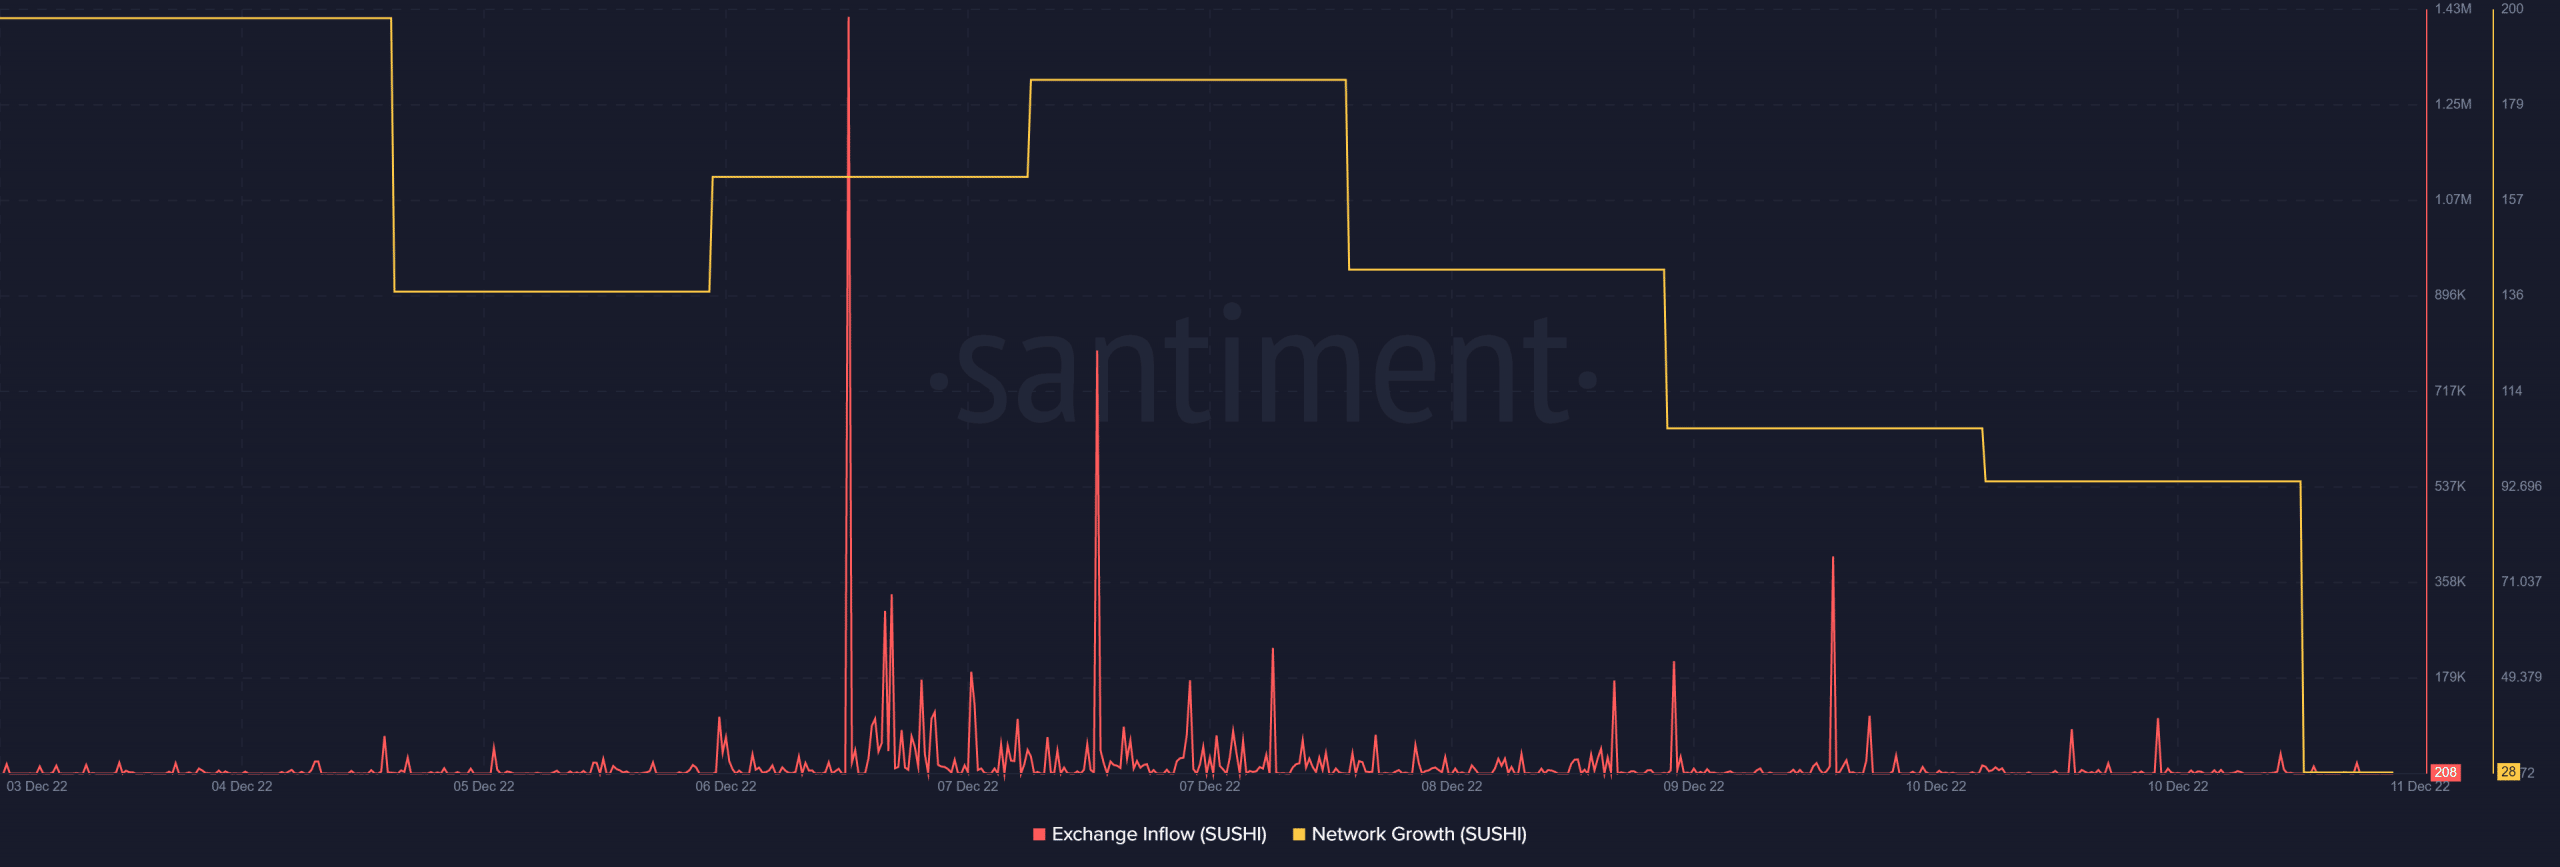
While the above metrics looked optimistic, a few of them indicated that the price plummet might go on for a while. SUSHI’s exchange reserve was increasing, which was a bearish signal as it indicated higher selling pressure.
Not only that, but the token’s exchange inflow registered a spike. SUSHI’s network growth also went down in the last seven days. This drives the chances of a continued downtrend.

Source: Santiment
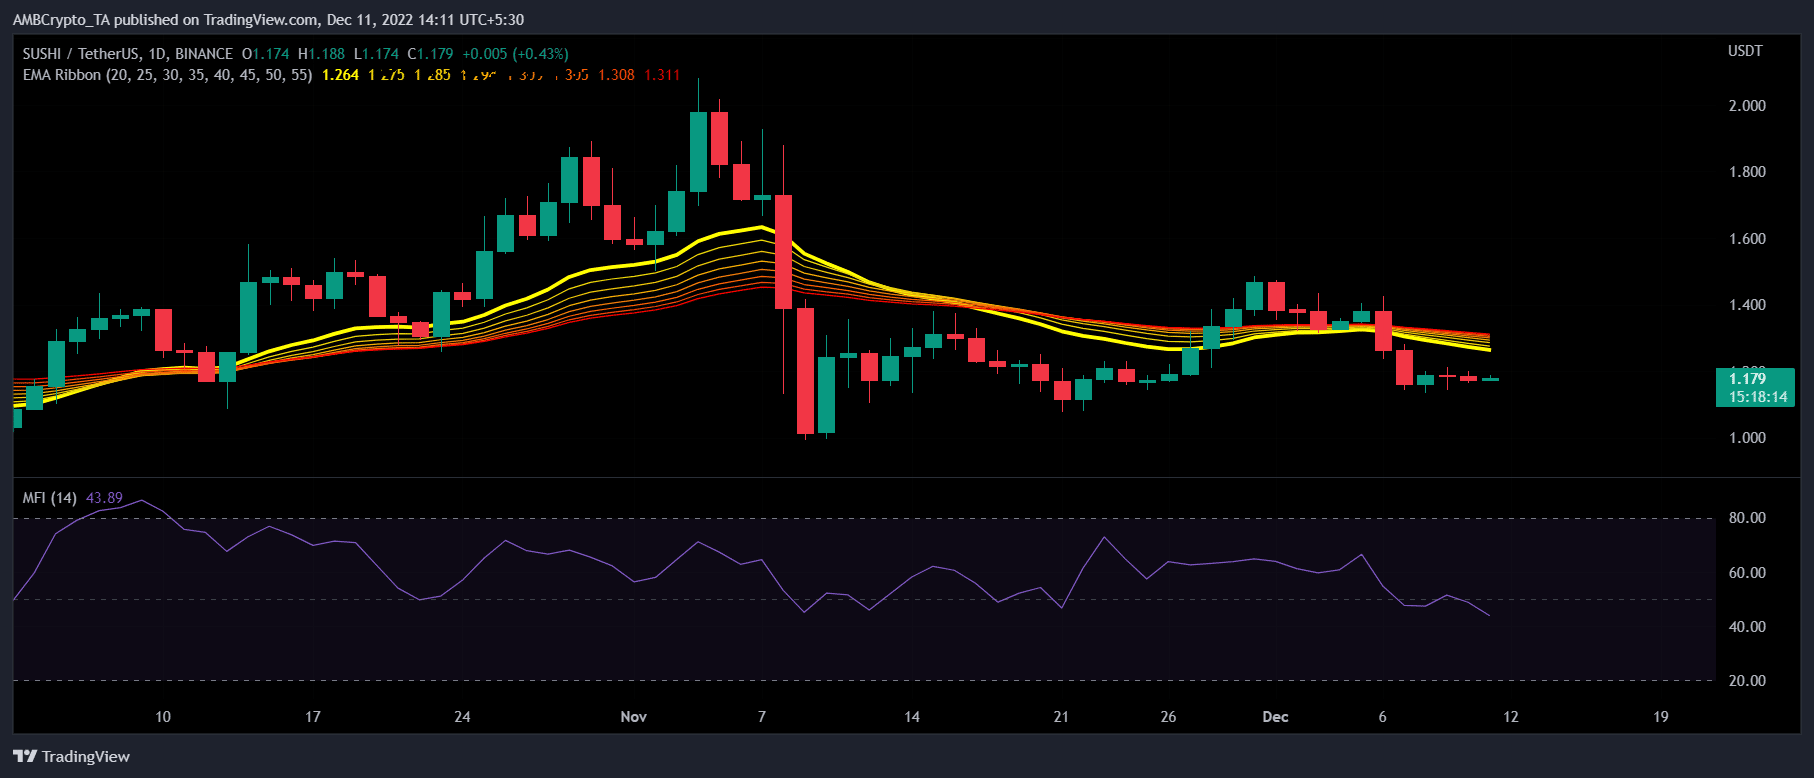
Interestingly, SUSHI’s daily chart suggested that the bears still had the upper hand in the market. The Exponential Moving Average (EMA) Ribbon displayed a bearish crossover. Moreover, the Money Flow Index (MFI) headed further below the neutral level, which could be concerning for investors.

Source: TradingView


