Read ApeCoin’s [APE] price prediction 2023-24
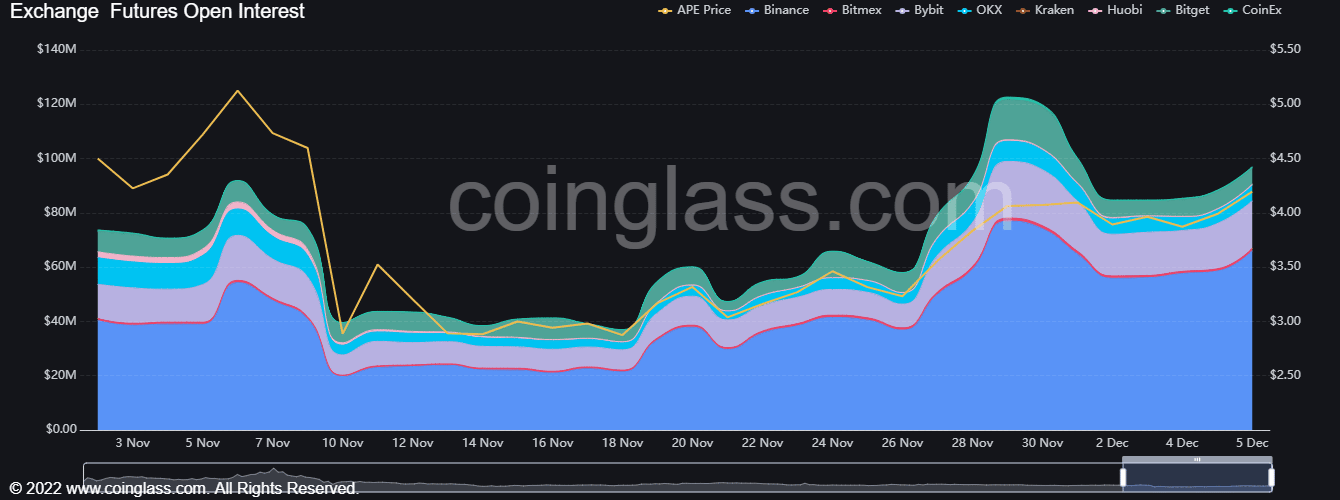
As mentioned in a previous article, ApeCoin saw significant resistance in the $4.2-$4.5 region. Open Interest behind the asset leaped upward as the price rallied past the $3.2 mark, but has waned somewhat in the past few days. On shorter timeframes, APE continued to have a bullish bias.
The 12-hour bearish breaker looms large as bulls try to advance past $4
Source: APE/USDT on TradingView
On the lower timeframes, ApeCoin had neutral to bearish momentum in the first couple of days of December. Only on 5 November did APE begin to see a renewed push from the buyers to drive prices past $4.2.
The region highlighted by the red box on the price chart represented a 12-hour bearish breaker formed on 2 November. It was a bullish order block at the time, but it was broken by the decisive selling on 8 November.
Since then it has represented a region of strong resistance. APE faced a rejection there on 30 November. ApeCoin slid from $4.47 to $3.78 on December 2. This bearish breaker also has confluence with the 61.8% and 78.6% Fibonacci retracement levels (yellow).
Bitcoin has resistance in the $17.6k-$18k region also. It was unclear how BTC or APE might move in the coming days. But, a rejection from the $4.2-$4.5 region was a possibility. The $4 mark was important psychologically. It was also a significant liquidity pocket in the past week.
Hence, a drop below it and a subsequent retest can offer a selling opportunity. Meanwhile, buyers can wait for a breakout past $4.6 and a retest of the $4.5-$4.6 region before looking to get in.
Open Interest is on the rise once more alongside the price

Source: Coinglass


