Data shows the NFT transaction dominance on Ethereum has now dropped to just 8.3%, as interest around the market has remained low.
NFT Dominance On Ethereum Falls, Whereas Stablecoins Pick Up More Share
As per data from on-chain analytics firm Glassnode, non-fungible tokens accounted for 18% to 22% of the total transactions on ETH in the first half of 2022.
The “dominance” here refers to the percentage of the total transactions taking place on the Ethereum blockchain that a certain type of token occupies.
ETH is a network that hosts a very rich ecosystem of applications, thanks to its smart contracts. Some of the popular constructs on the chain include stablecoins, NFTs, Decentralized Finance (DeFi) apps, and ERC20 tokens.
Here is a chart that shows how the dominances of two of these applications, non-fungible tokens and stablecoins, have changed during the last few years:
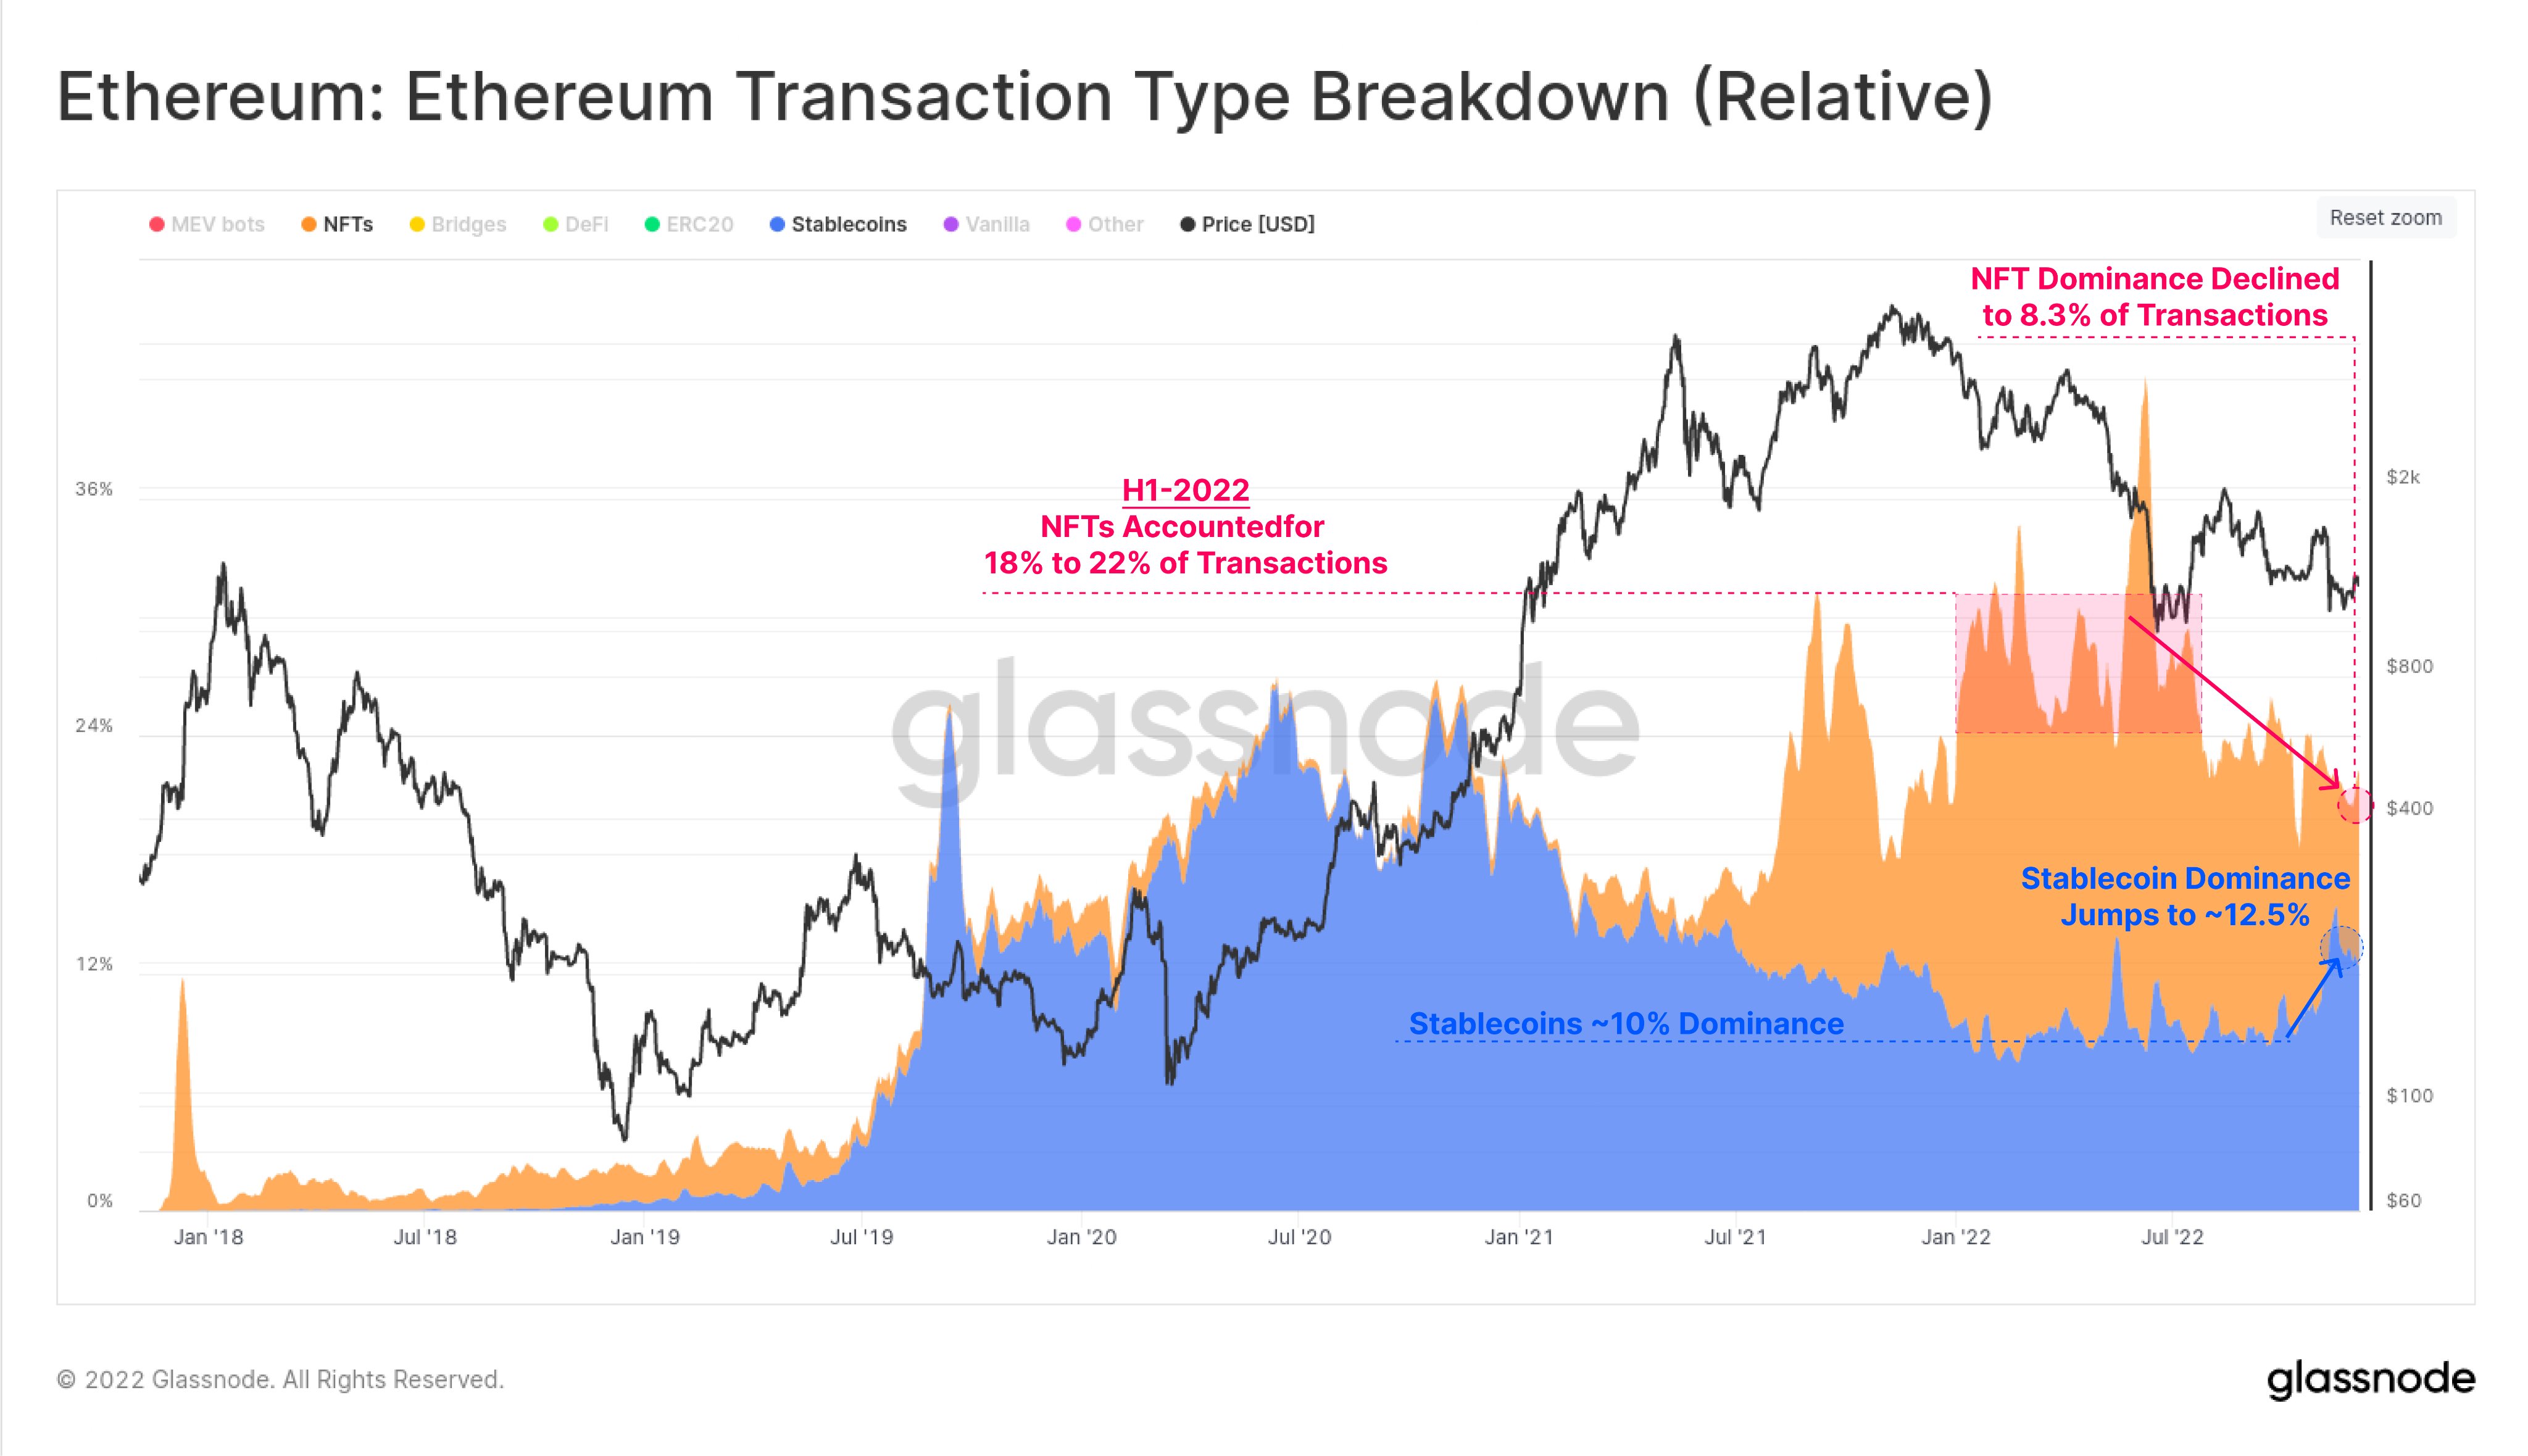
Looks like stablecoins have gained more dominance in recent weeks | Source: Glassnode on Twitter
As you can see in the above graph, NFTs prospered on the Ethereum blockchain during the first half of this year as they accounted for around 18% to 22% of all transactions happening on the network.
During this same period, the dominance of all stablecoins on the blockchain fluctuated around a value of about 10%.
With the start of the second part of 2022, however, things started changing for the previously flourishing non-fungible token market.
The long and deep sector-wide bear market resulted in investor interest around NFTs to fade, which showed up as a steep decline in the dominance of these tokens on the Ethereum blockchain.
Following this drawdown in the percentage of digital collectible-related transfers happening on the network, the dominance of these tokens is now only 8.3%.
While the NFTs were going through a decline, the stablecoins managed to hold on and move mostly sideways, until the FTX crash came, which actually resulted in an increase in the dominance of the combined stablecoin market.
Now, stablecoins contribute to around 12.5% of the total transactions taking place on Ethereum, more than the dominance of the non-fungible token market.
ETH Price
At the time of writing, Ethereum’s price floats around $1.2k, up 6% in the last week. Over the past thirty days, the crypto has amassed 23% in losses.
Below is a chart that shows the trend in the price of the coin over the last five days.