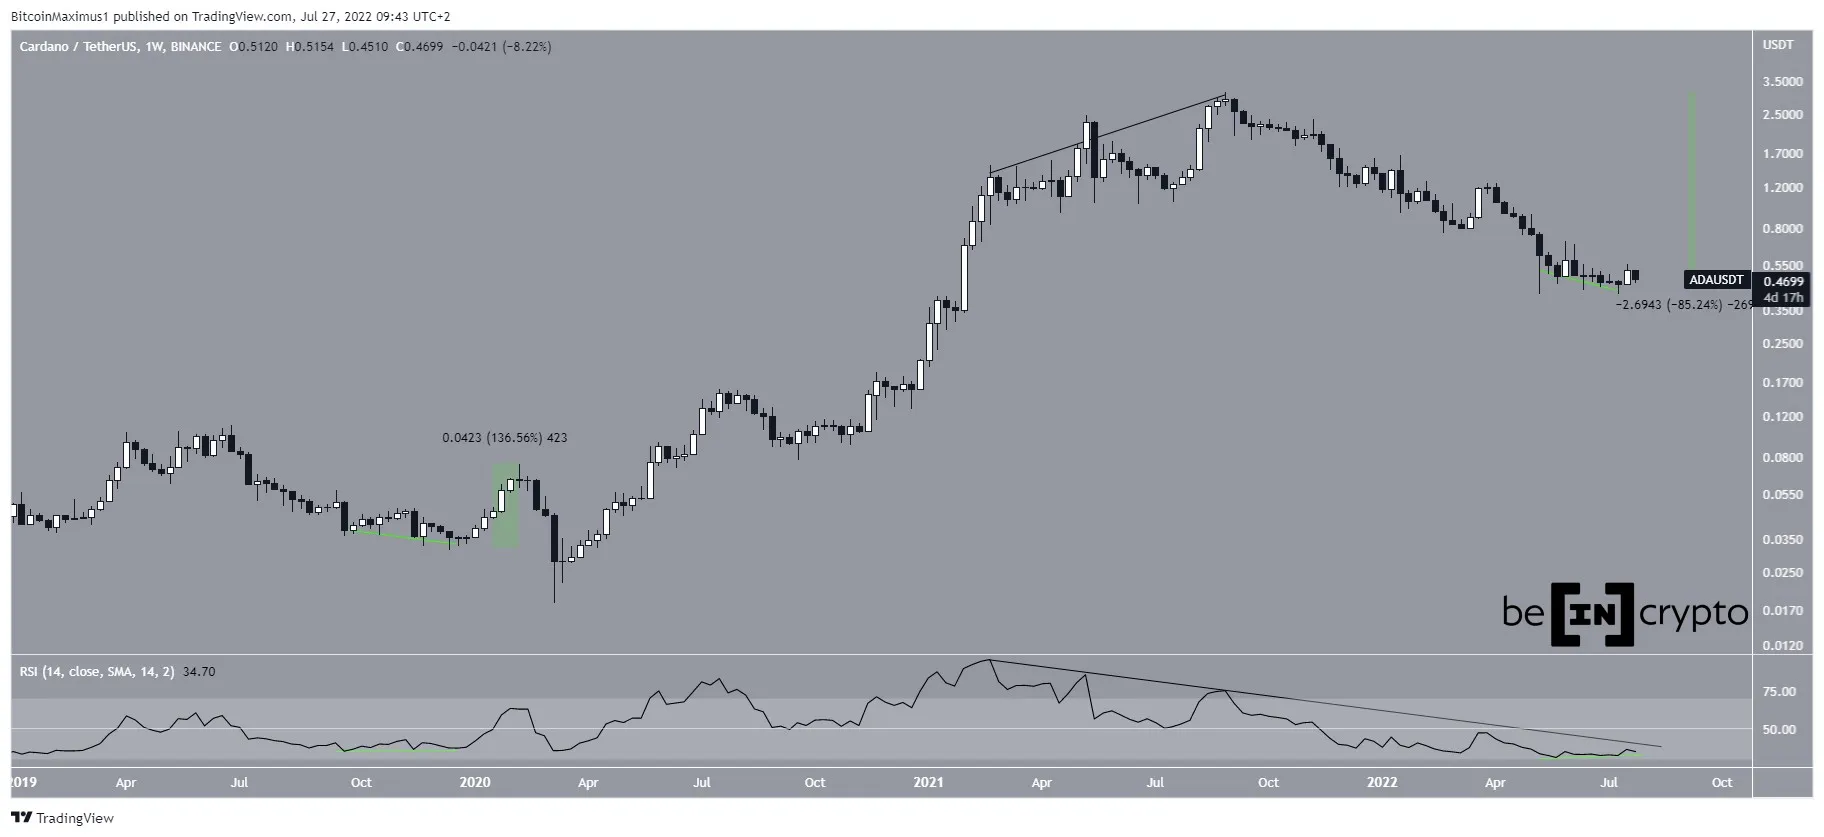
Cardano (ADA) broke out from a 307-day descending resistance line after both the weekly and daily RSI generated bullish divergence.
ADA has been decreasing since reaching an all-time high of $3.10 in Sept 2021. The downward movement so far led to a low of $0.40 in May 2022.
The price has increased slightly since, but is still trading at $0.47. Measuring from the all-time high, the price has so far decreased by 85%.
/Related
MORE ARTICLES
FTX: How to Prevent a Similar Dumpster Fire

FTX Japan Will Begin Customer Refunds In February 2023

Pi Network (PI) Listing Sparks Controversy as Price Skyrockets

Stablecoins Dominate the Trading Volume in the Last Crypto Friday of 2022
This Week in Crypto: SBF Gets Bail, Solana Dumpster Fire Continues and Could BNB Be a Security?
AI Chatbots Could Become the Future of the Metaverse
The most interesting reading comes from the weekly RSI, which has generated bullish divergence (green line). The only other time the weekly RSI generated bullish divergence was in Dec 2019 and led to an upward movement of 135%.
However, the RSI is still following its bearish divergence trend line (black) and trading below 50. A breakout from this line would confirm that the bullish reversal has begun.
 ADA/USDT Chart By TradingView
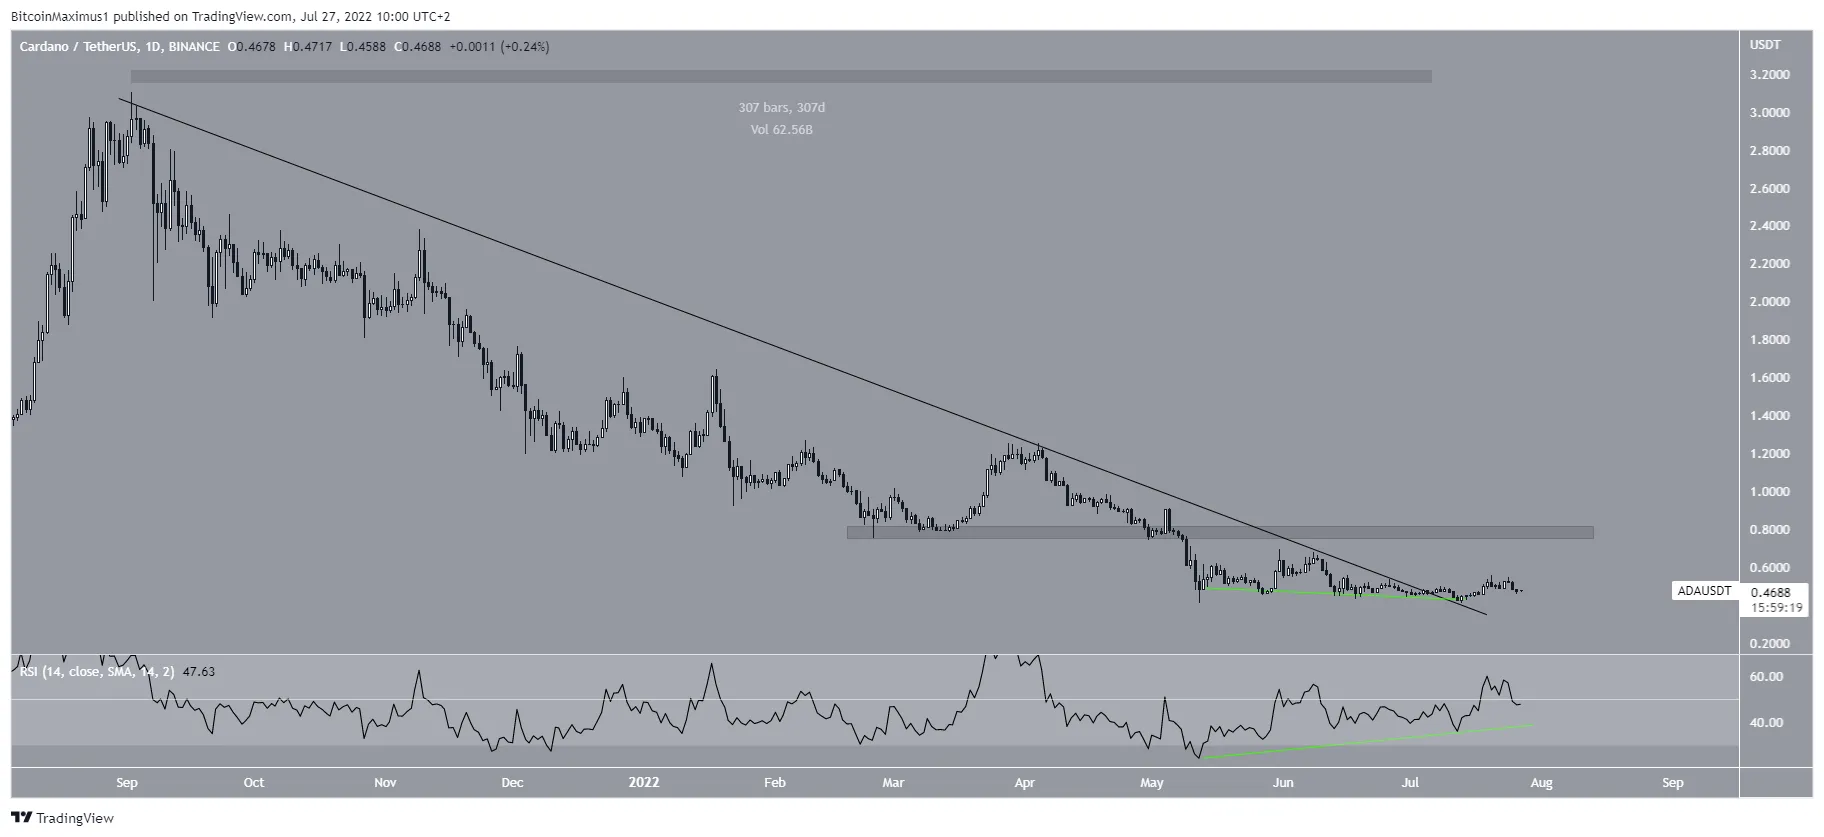
Long-term breakout
Similar to the weekly chart, the daily one provides a bullish outlook. The main reason for this is that the price has broken out from a descending resistance line that had been in place for 307 days. Breakouts from such long-term structures are usually a sign that the preceding trend is complete.
Moreover, the daily RSI has generated a significant amount of bullish divergence (green line).
If the upward movement continues, the closest resistance area would be at $0.78.
 ADA/USDT Chart By TradingView
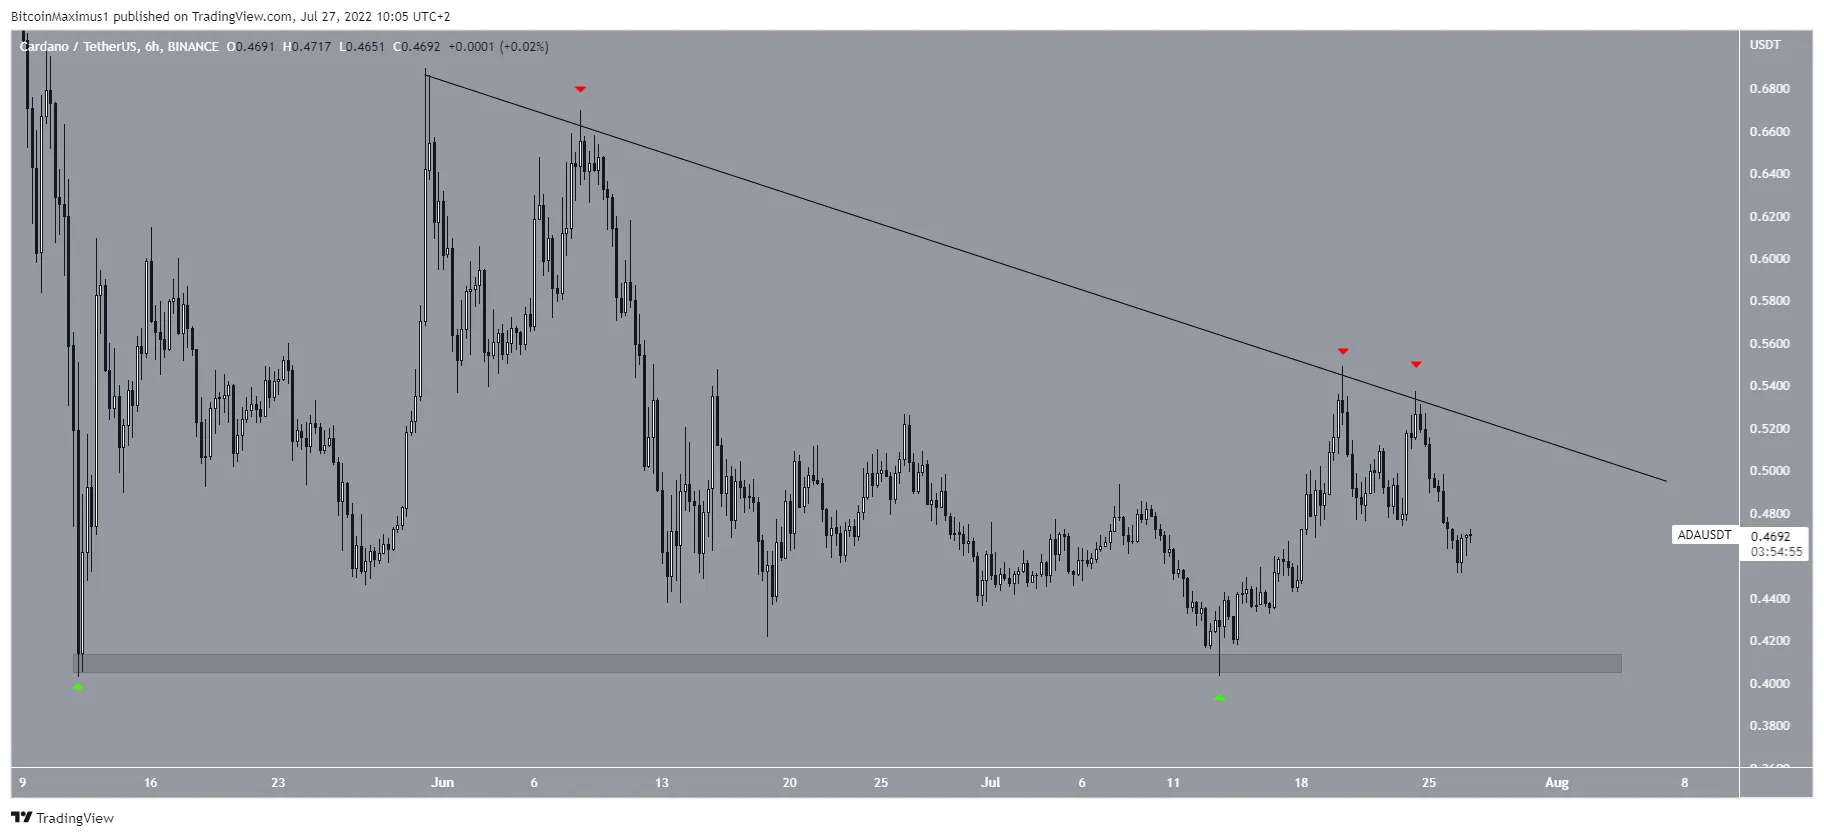
ADA retracement
The six-hour chart shows a potential double bottom pattern inside the $0.41 horizontal support area. The double bottom is considered a bullish pattern, meaning that it leads to breakouts the majority of the time.
However, the price is still following a descending resistance line, which has so far caused three rejections (red icons). A breakout from the line would confirm the double bottom pattern and indicate that the price is heading upwards.
 ADA/USDT Chart By TradingView
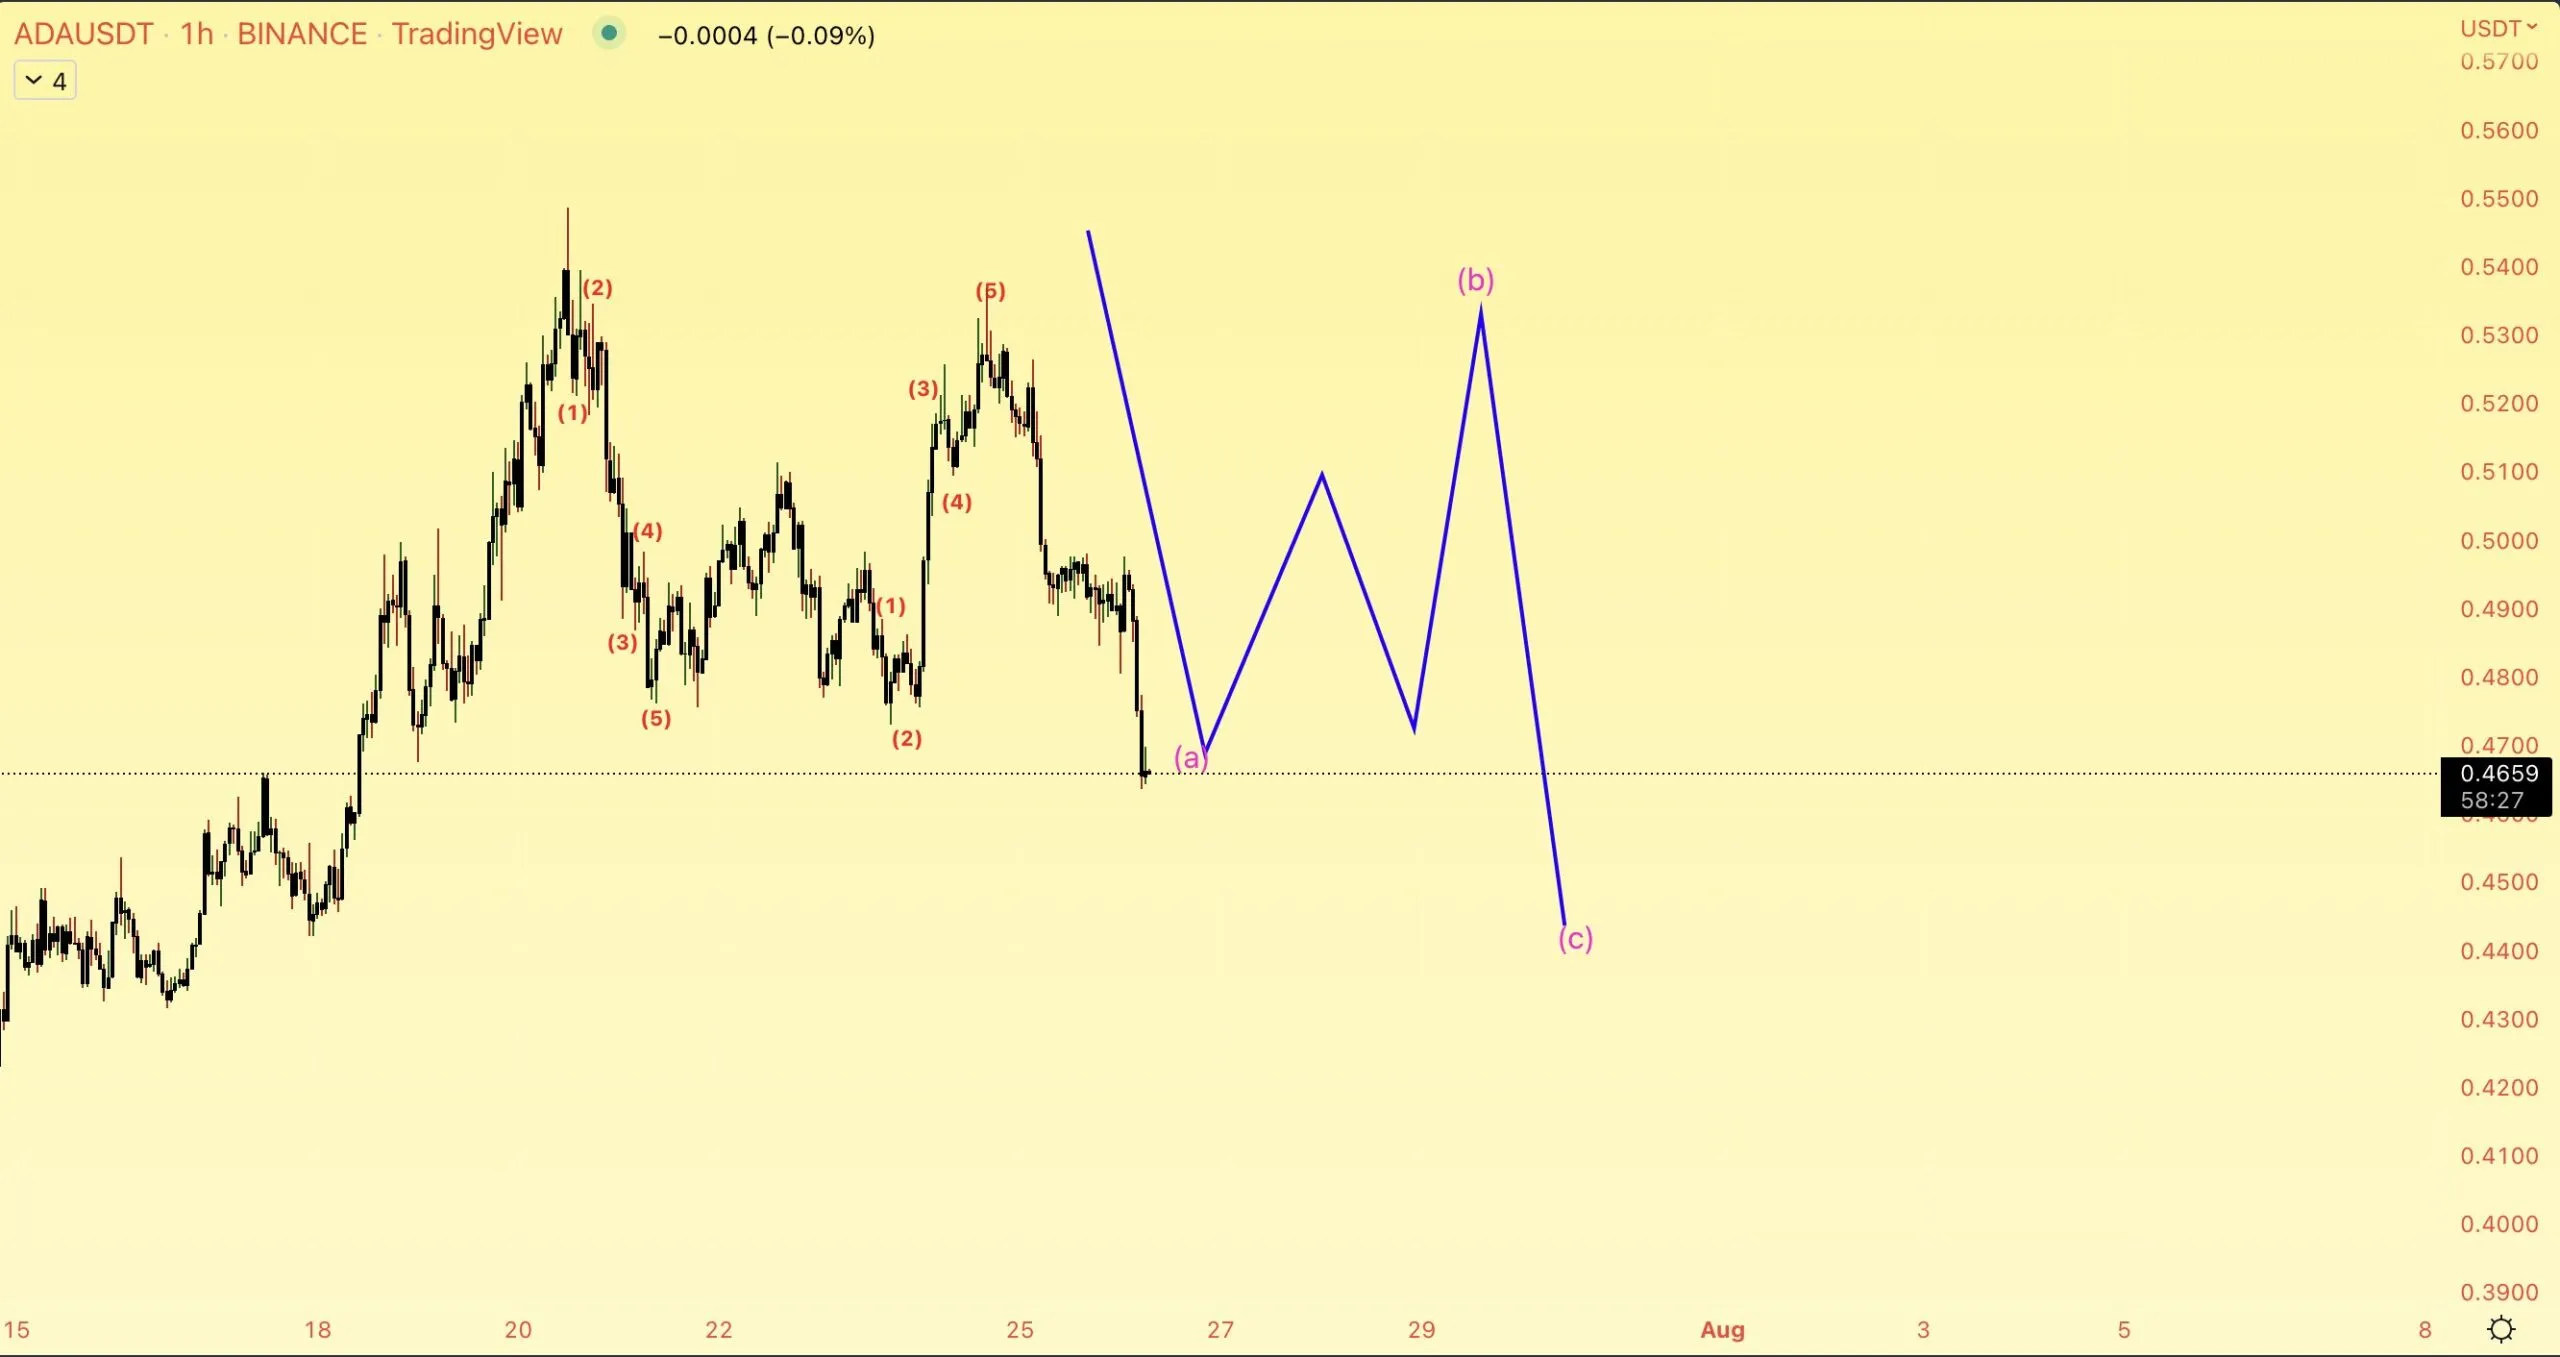
Cryptocurrency trader @altstreetbet tweeted a chart of ADA, stating that the price is likely to decrease towards $0.45.
 Source: Twitter
Since the tweet, ADA has already reached the target. The entire decrease looks like a corrective A-B-C pattern (black). The pattern led to a decrease below the 0.618 Fib retracement level, but the price has reclaimed it since.
If it manages to hold on above it, it would likely lead to a breakout from the aforementioned resistance line and higher prices.