This possibility is also supported by the creation of a short-term bearish pattern.
ADA’s Critical Resistance
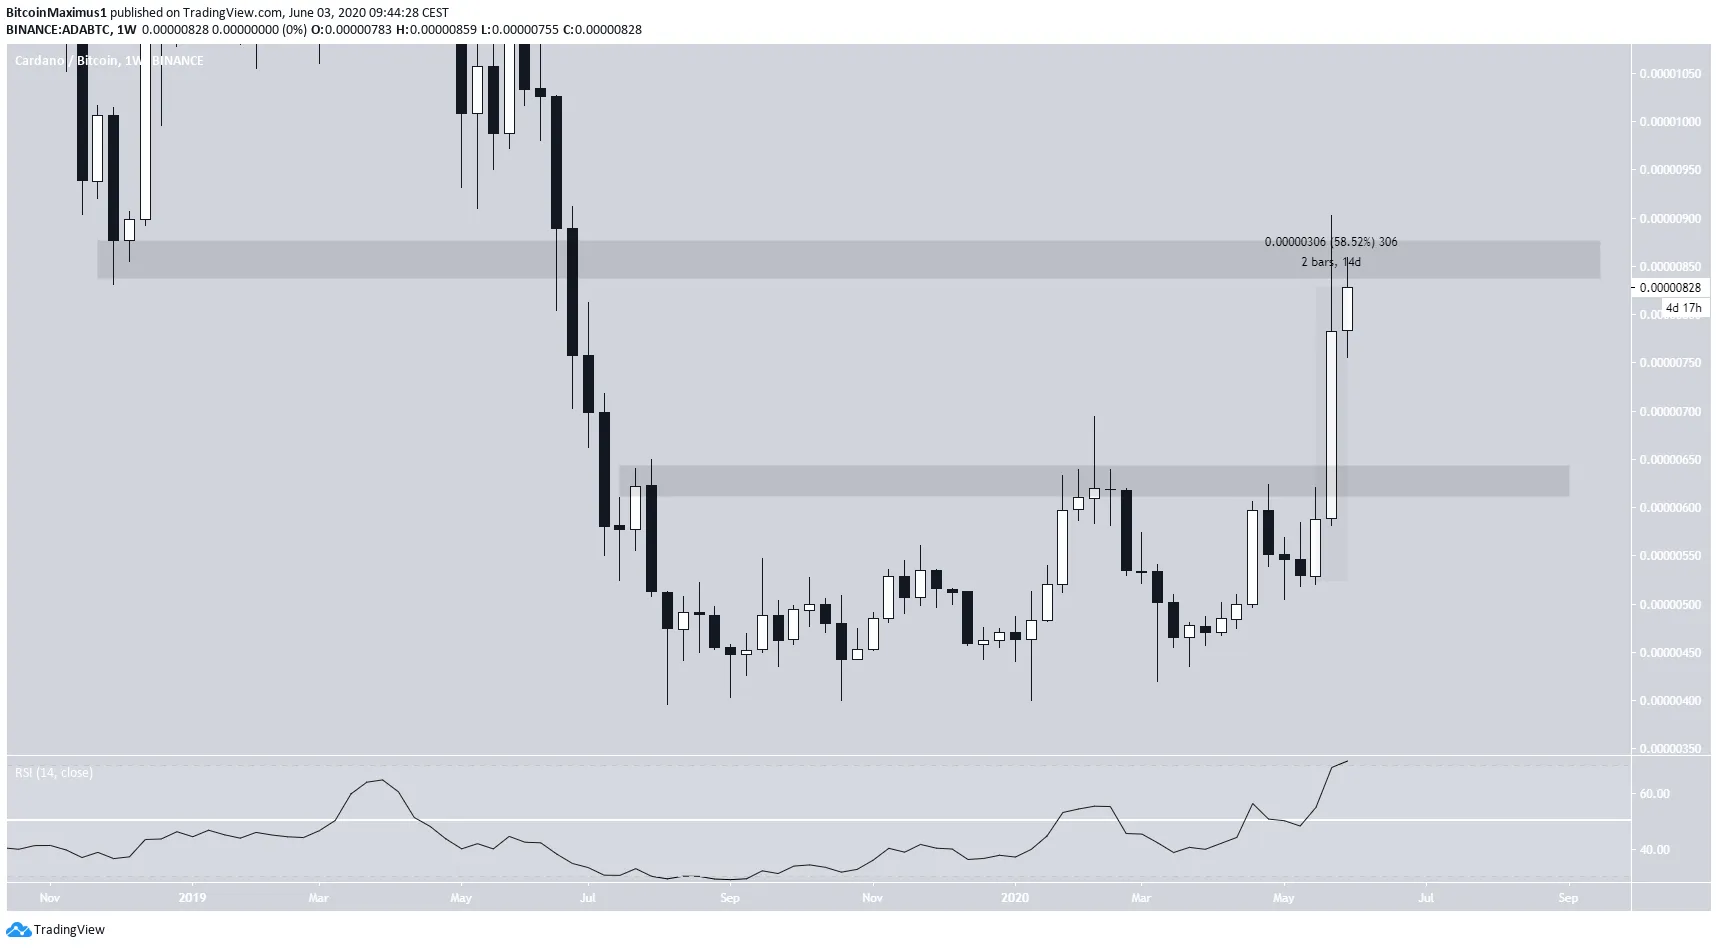
ADA has increased by 58% over the past 14 days, creating three successive bullish candlesticks in the weekly time-frame. However, the price is trading inside a very important weekly resistance level, found at 860 satoshis. While a flip of this resistance area could trigger a very rapid increase in price due to the lack of overhead resistance, the same stands true for the lack of support if the price gets rejected. The closest support level is found at 620 satoshis.
 ADA Chart By Tradingview
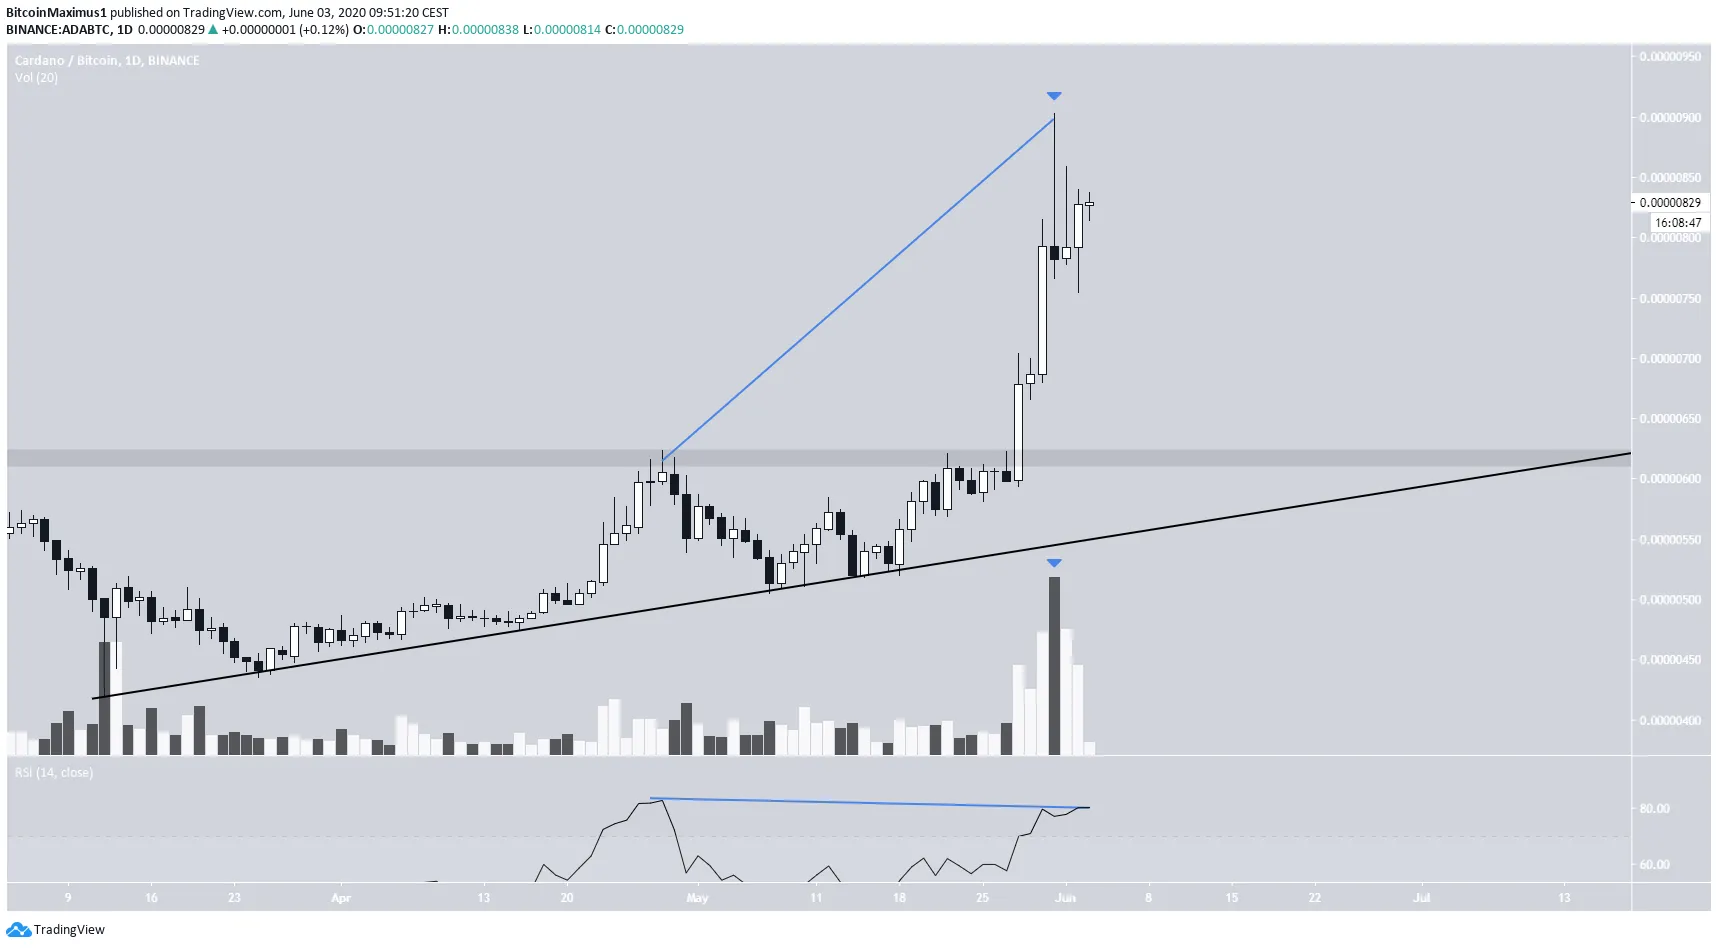
In the daily time-frame, we can see that a very significant bearish divergence has developed in the RSI. In addition, the price has created a bearish Doji with significant volume on May 31. When following an upward trend, this can be read as a sign of reversal, especially considering that it is occurring inside a higher time-frame resistance area. Therefore, the outlook from the daily time-frame suggests that ADA will not break out from the 860 resistance area on the first try, rather it will likely decrease.
 ADA Chart By Tradingview
Short-Term Movement
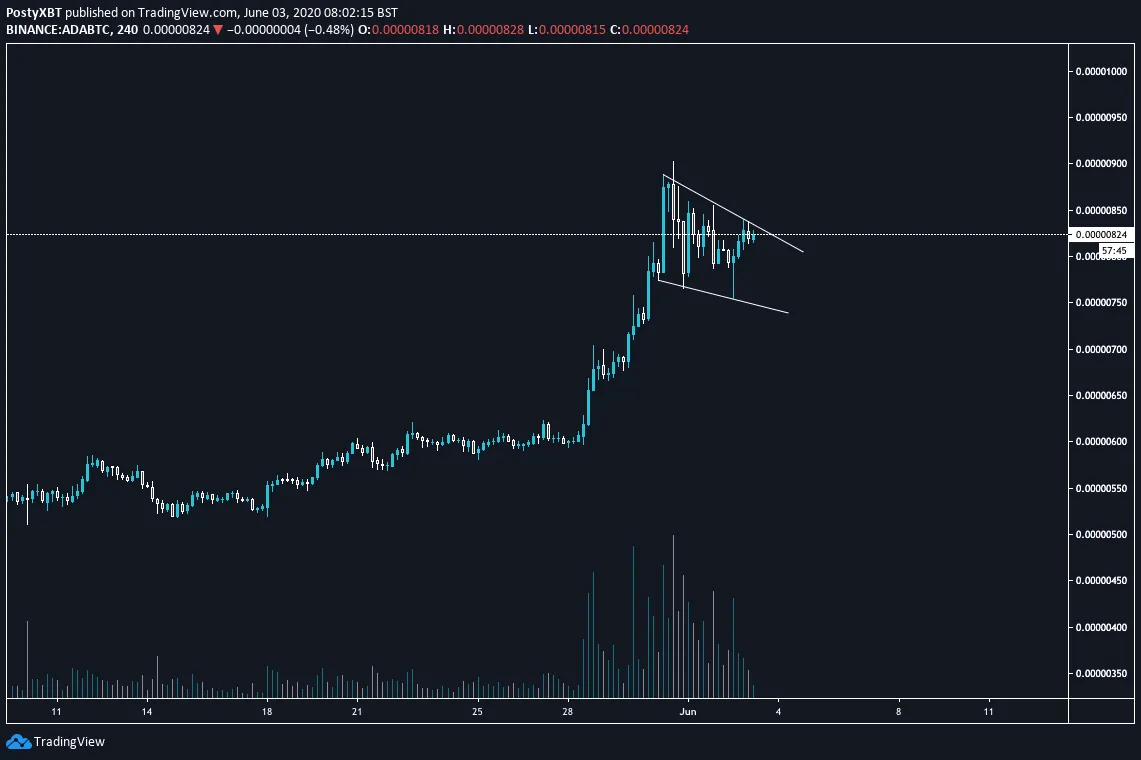
An ADA chart was outlined by @PostyXBT, which shows a short-term descending wedge developing, which is considered a bullish reversal pattern.
 Source: Twitter
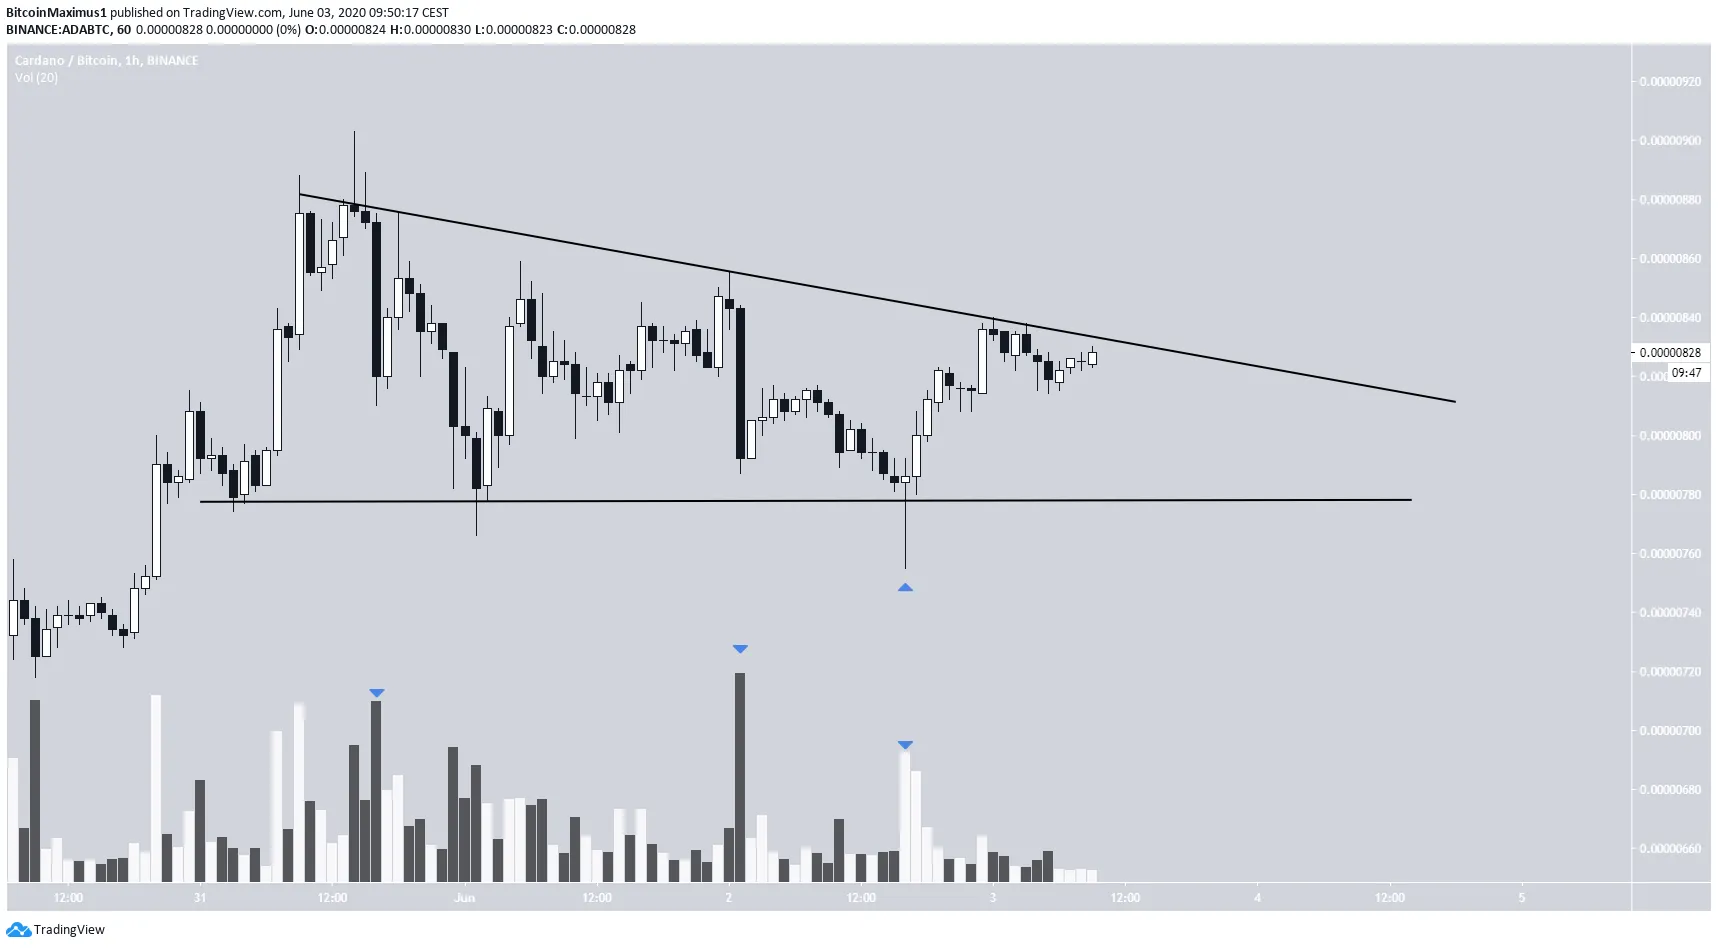
However, depending on which time-frame is used, the pattern for ADA looks more like a descending triangle than a descending wedge. The descending triangle is considered a bearish pattern. Furthermore, throughout the movement inside this pattern, volume has been considerably lower in bullish candlesticks than in their bearish counterparts. This is a sign of selling pressure. If the price were to break down from this triangle, which seems likely, it could take the price towards 700 satoshis. Since the price is currently directly under the resistance line, an increase above 845 satoshis would invalidate the bearish scenario.
 ADA Chart By Tradingview
To conclude, the ADA price has reached an important resistance level in higher time-frames and technical indicators have been showing weakness. The price is expected to break down from its short-term pattern and decrease towards 700 satoshis.