
On November 28, the Cardano foundation announced that it is releasing Adapay. This allows merchants to settle transactions with ADA in 35 fiat currencies, which are directly linked with their bank accounts. The next day, the ADA price began an upward move, at one point increasing by nine percent.
Well-known trader @postyXBT tweeted that today’s close for the ADA price is very important in determining future price levels. He posted a chart in which the current Cardano price closing above a previously significant resistance area that has been in place since August. If ADA closes above this resistance, how high will it go?
Ascending Triangle
The Cardano price has been trading inside an ascending triangle since August. While it has reached values above the horizontal resistance area several times, it created a long upper wick and decreased below each time. Currently, the ADA price has moved above this resistance line. If the price reaches a close above it, it would likely indicate that a breakout has occurred.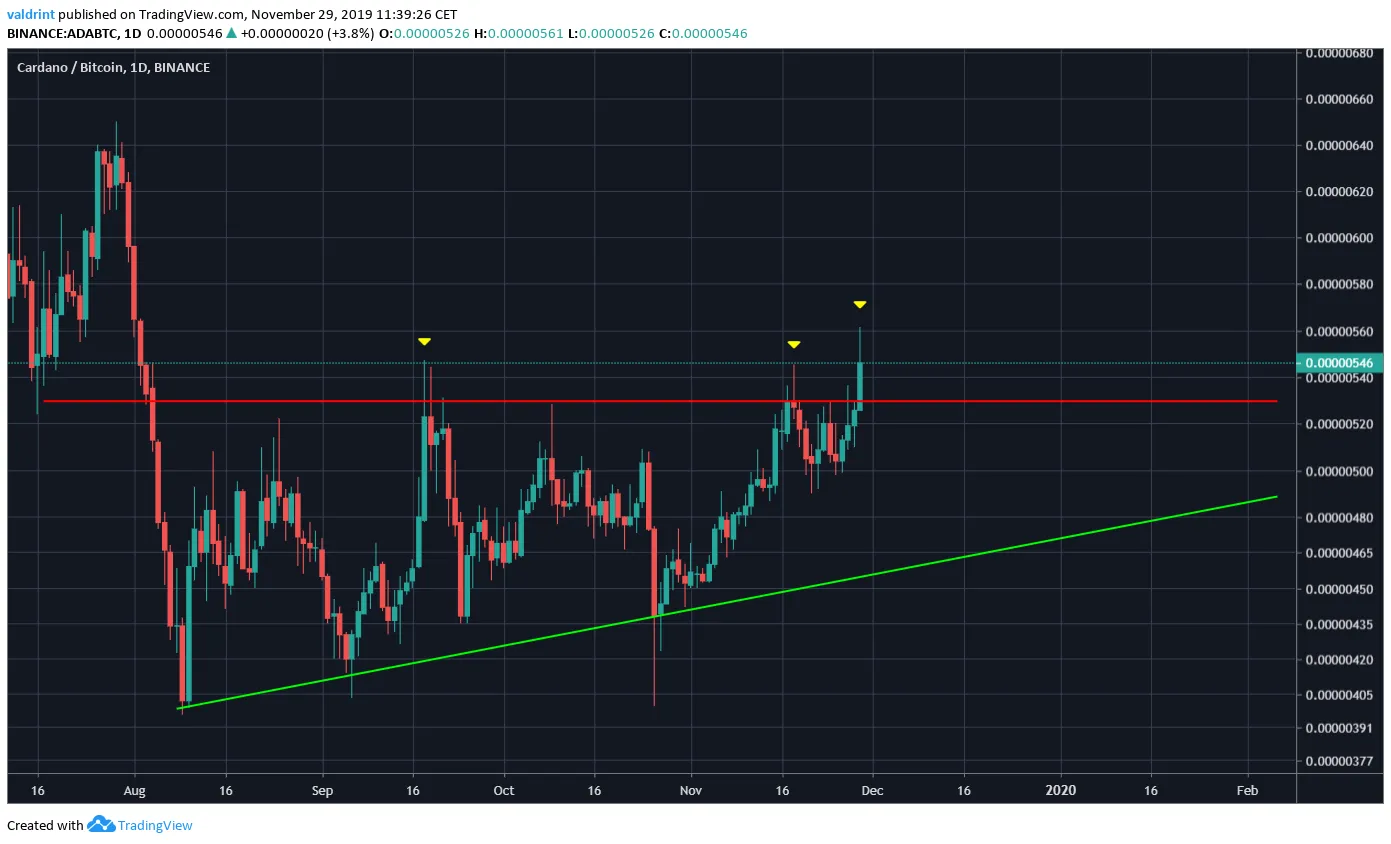 If Cardano continues moving upward, it should find resistance near 630 satoshis — both a previous resistance area and the 200-day moving average (MA).
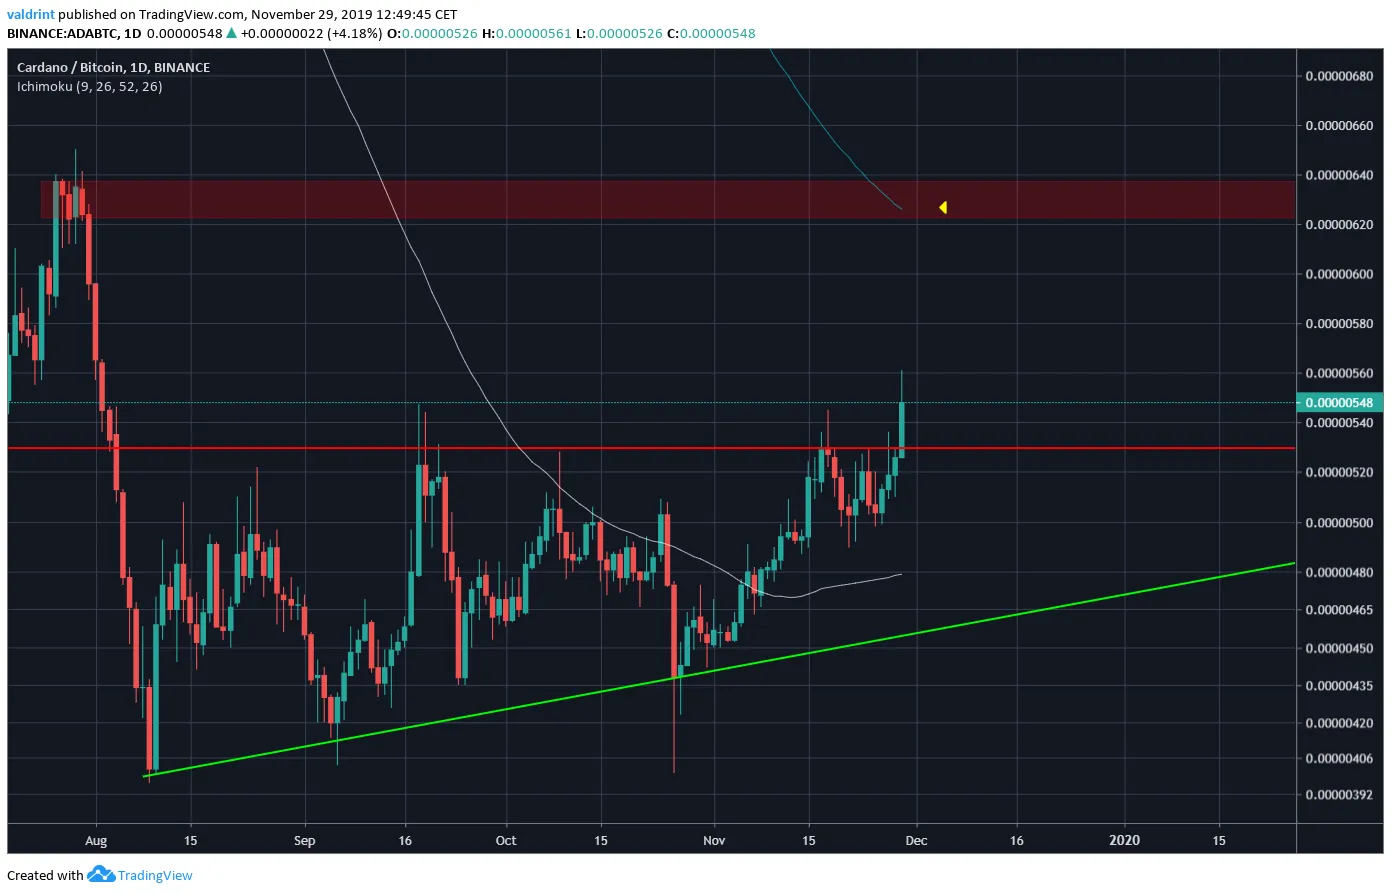
Long-Term Cardano Outlook
The main reason why we believe this breakout will eventually happen is the extremely bullish outlook coming from the weekly time-frame. The Cardano price generated three long lower wicks and made a triple bottom — which is a bullish pattern. This was combined with a bullish divergence in the RSI and also a bullish weekly MACD cross. This suggests that ADA is ready for a new market cycle and an upward move will soon follow.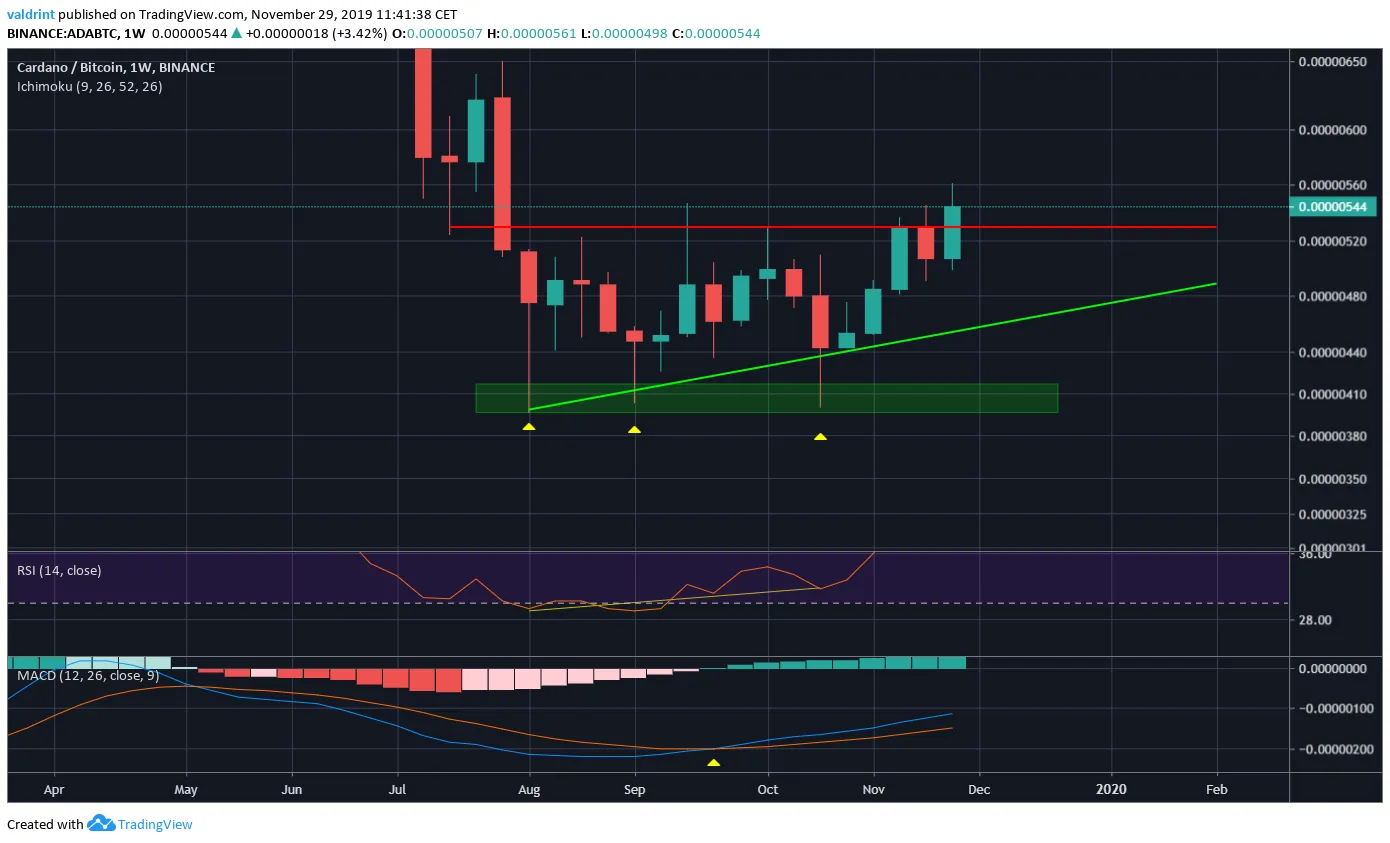 Today’s close will go a long way in determining whether the upward move will begin today or at a later date.


