
 At the time of writing, Cardano was trading near 630 satoshis, very close to its all-time low. Will it begin a reversal? Keep reading below in order to find out If you want to trade cryptocurrencies safely and securely on our partner exchange, follow this link to get set up on XCOEX. For our previous analysis, click here.
Cardano Price: Trends and Highlights for July 9
- ADA is close to reaching an all-time low price.
- It is trading inside a descending wedge.
- There is bullish divergence developing in the RSI and the MACD.
- There is significant resistance provided by the moving averages.
- There is resistance near 745, 815 and 930 satoshis.
ADA Price in a Descending Wedge
Since reaching a high of 953 satoshis on May 23, ADA has been decreasing — trading inside the descending wedge outlined below.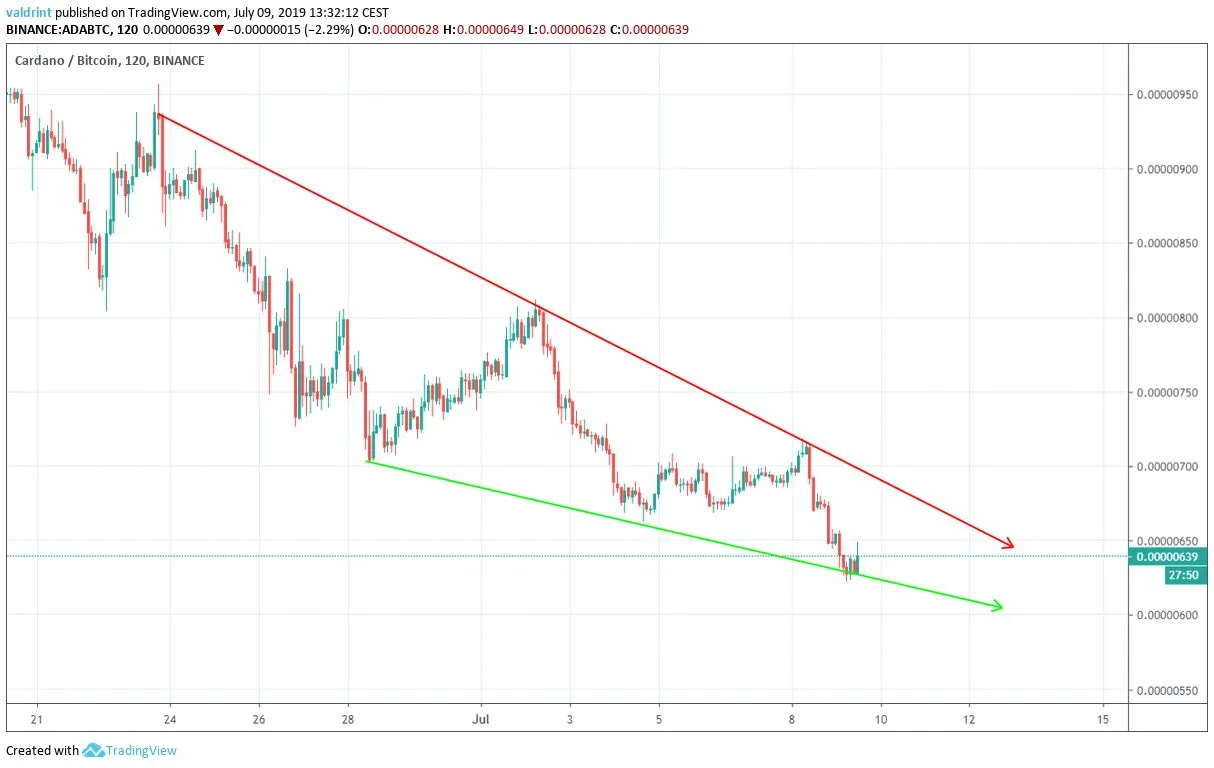 Both the resistance and support lines have been touched three times. However, the beginning of the support line occurred on May 28, five days after the resistance. The wedge is projected to end on June 15 the latest. Since it is a bullish pattern, a breakout is more likely.
Another Breakout Attempt?
This possibility is supported by both the RSI and the MACD.
Reversal Areas
Reversal areas are found by Fibonacci levels and previous support/resistance. Three reversal areas are outlined below: The closest resistance area is found near 745, followed by resistance areas near 815 and 930 satoshis. According to our analysis, the Cardano price is likely to reach at least one of these areas.
Summary
The ADA price is very close to reaching an all-time low. However, it is trading inside a short-term descending wedge. Momentum indicators suggest that a breakout will occur. However, due to the resistance provided by the MAs, the breakout could be short-lived. Do you think the ADA price will make an all-time low? Let us know in the comments below.


