Cardano (ADA) reached a new all-time high price on April 14. However, it dropped almost immediately afterward.
Despite the drop, ADA has held above its previous diagonal and horizontal support levels. An eventual breakout is expected.
Long-Term ADA Movement
On Feb. 27, ADA reached a then all-time high price of $0.148. While it decreased almost immediately afterward, the drop served to validate the $1.03 area as support.
The token bounced afterward and reached a new all-time high price of $1.57 on April 14. However, it has fallen once more since.
The technical indicators show mixed readings. The MACD is positive but has created one lower momentum bar. The RSI is right at the 70 line. Similarly to the MACD, the Stochastic oscillator has not made a bearish cross but is decreasing.
Furthermore, there are long upper and lower wicks present.
/Related
MORE ARTICLES
BlockFi To Reveal Financial State Post FTX Collapse and Bankruptcy Filing

Will Crypto Volatility Crunch Precede an Explosive Move for BTC and ETH?

Quantum Computers Break Encryption in China But Far From Cracking Bitcoin
GALA 230% Pump Compromised by Hefty Crypto Distribution Schedule
Flare Network Airdrop Kicks Off for Eligible XRP Holders
France and Hong Kong Accelerate Towards Crypto Regulation
Therefore, a look at lower time-frames is required to determine the direction of the next move.
 Chart By TradingView
Current Breakout
The daily chart shows that ADA has broken out from a descending resistance line before reaching the all-time high.
Despite the massive long lower wick, yesterday’s drop only served to validate the line as support.
However, the token is trading above both diagonal and horizontal support levels. So, the trend can be considered bullish.
ADA Wave Count
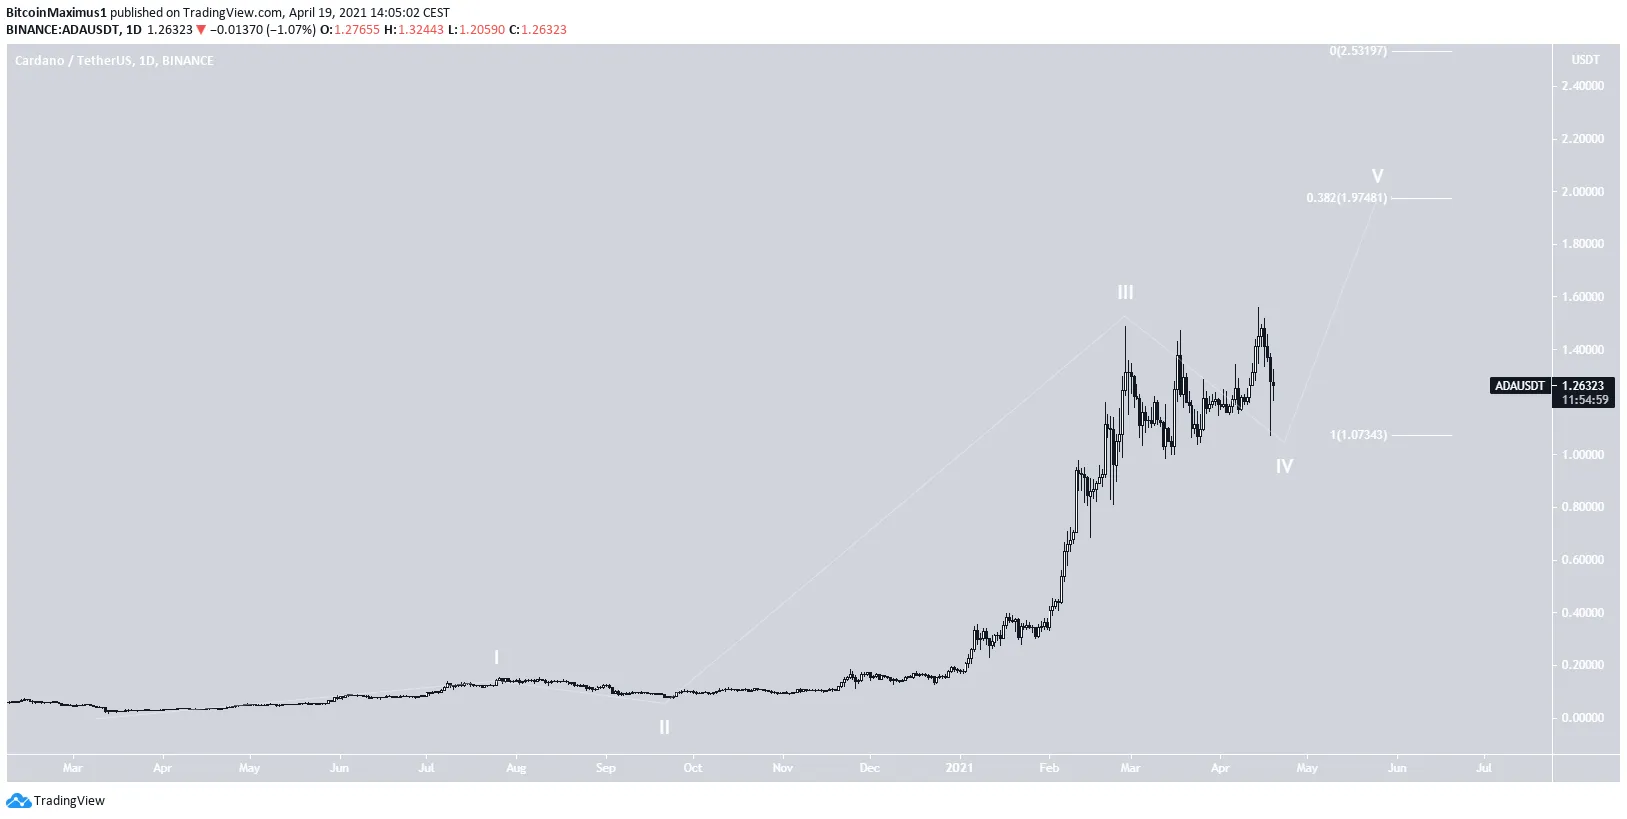
The wave count indicates that ADA is in wave four of a bullish impulse (white) that began in March 2020.
Once wave four is completed, two potential targets for the top of the movement are $1.97 and $2.53.
The targets are found by using a Fib projection on waves 1-3.
 Chart By TradingView
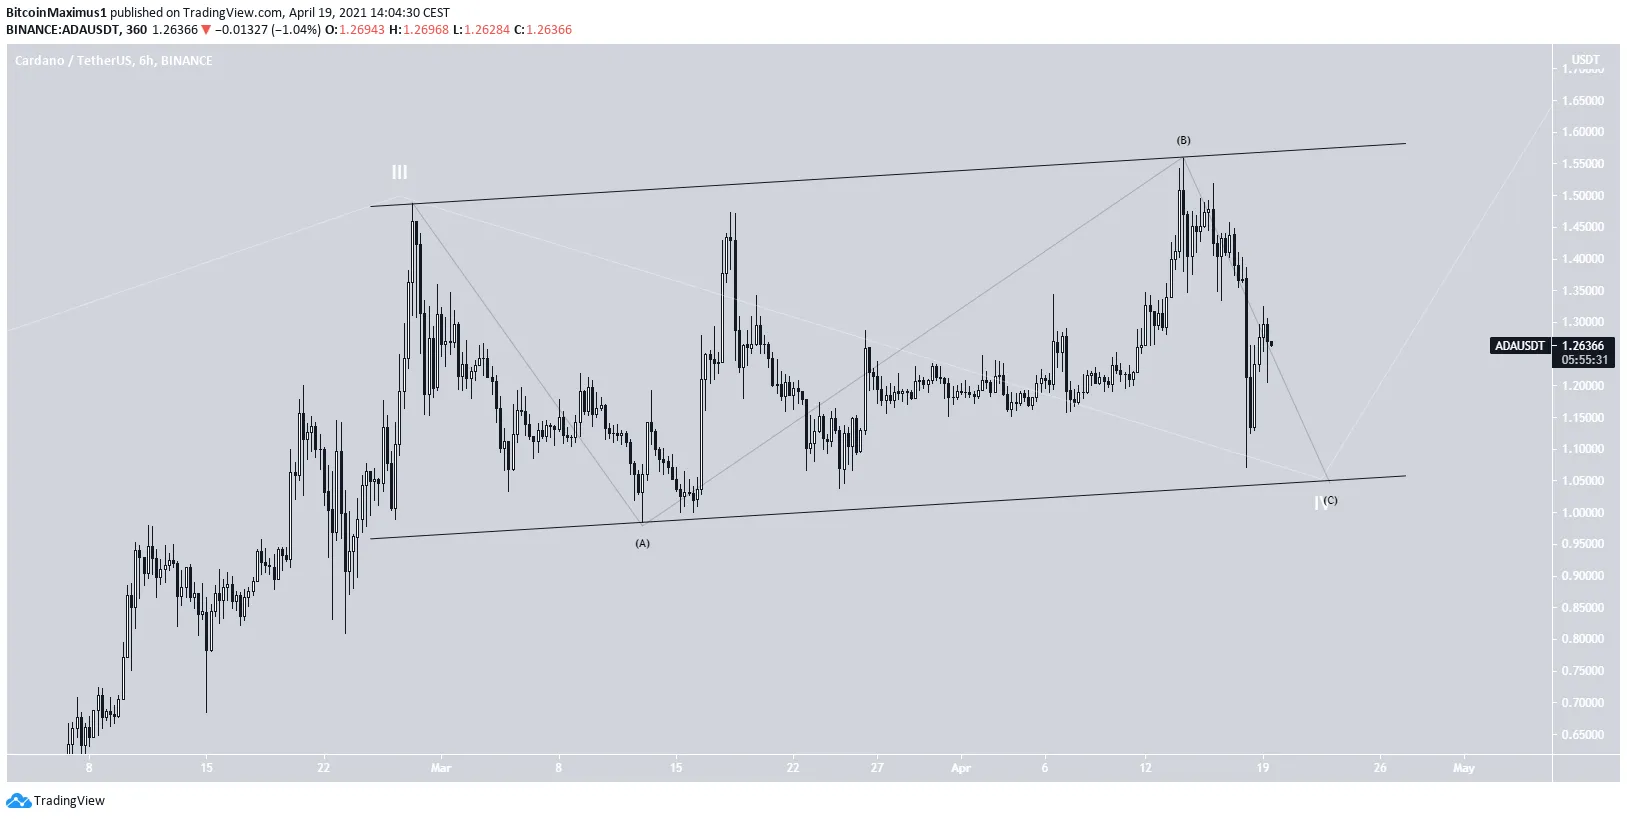
A closer look supports this possibility, showing a parallel ascending channel. This is often a corrective movement.
After potentially another lower low that validates the support line of the channel, a breakout is expected.
 Chart By TradingView
Conclusion
To conclude, ADA is expected to break out from the current channel eventually. Afterward, it could increase towards $1.97 and potentially $2.53.


