Here’s AMBCrypto’s Price Prediction for Bitcoin for 2022-2023
However, recent antecedent like the 50% altcoin market dominance on 23 October could drive BTC to the backseat. According to the analyst, this percentage constituted the altcoin dominance on exchange activity within the aforementioned period. He added that if this episode extends itself, it could leave Bitcoin in a state of capitulation, like in April and November 2021.
During these periods, BTC fell from $47,000 to $20,000 and $67,000 to $36,000, respectively. Hence, the king coin could be at risk one more time.
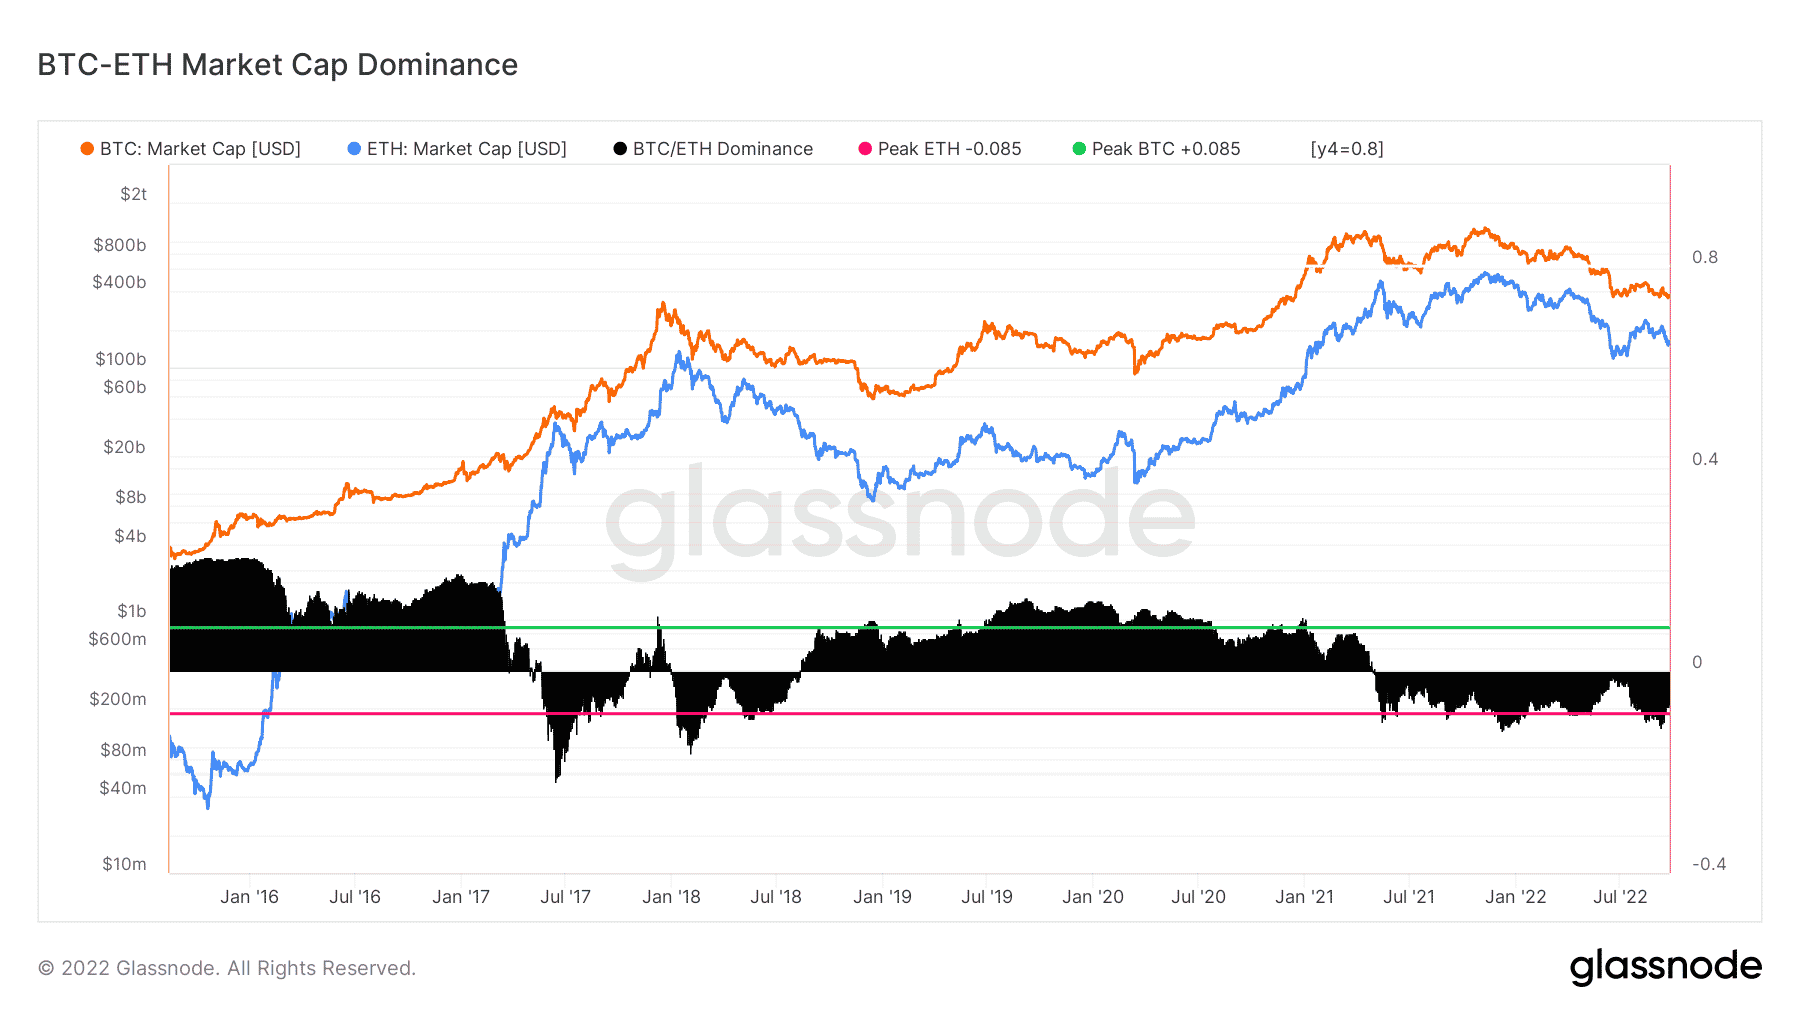
Now, an assessment of the BTC-ETH dominance chart showed that Bitcoin is still in control.
Despite that, however, Glassnode showed that Ethereum has been in a heated contest with the crypto. The on-chain analytics platform revealed that ETH peak dominance was -0.085. As for BTC, it remained positive with a reading of 0.085.
The implication of this is that investors still regard BTC as a preferred asset. Additionally, BTC’s value, compared to other cryptocurrencies, has maintained a race that other cryptocurrencies might never win.
For the exchange netflows, Glassnode reported that BTC recorded more negatives than ETH. Over the past week, BTC’s exchange netflow was -$1.8 billion. For ETH, it was -$183.9 million.
Despite these lows, however, both coins seemed to have rebounded a little over the last 24 hours.
According to CoinMarketCap, BTC appreciated by 0.82% while trading at $19,333. Here, it’s worth noting that the rebound has not stopped institutional investors from withholding their restrictions on adding more BTC.
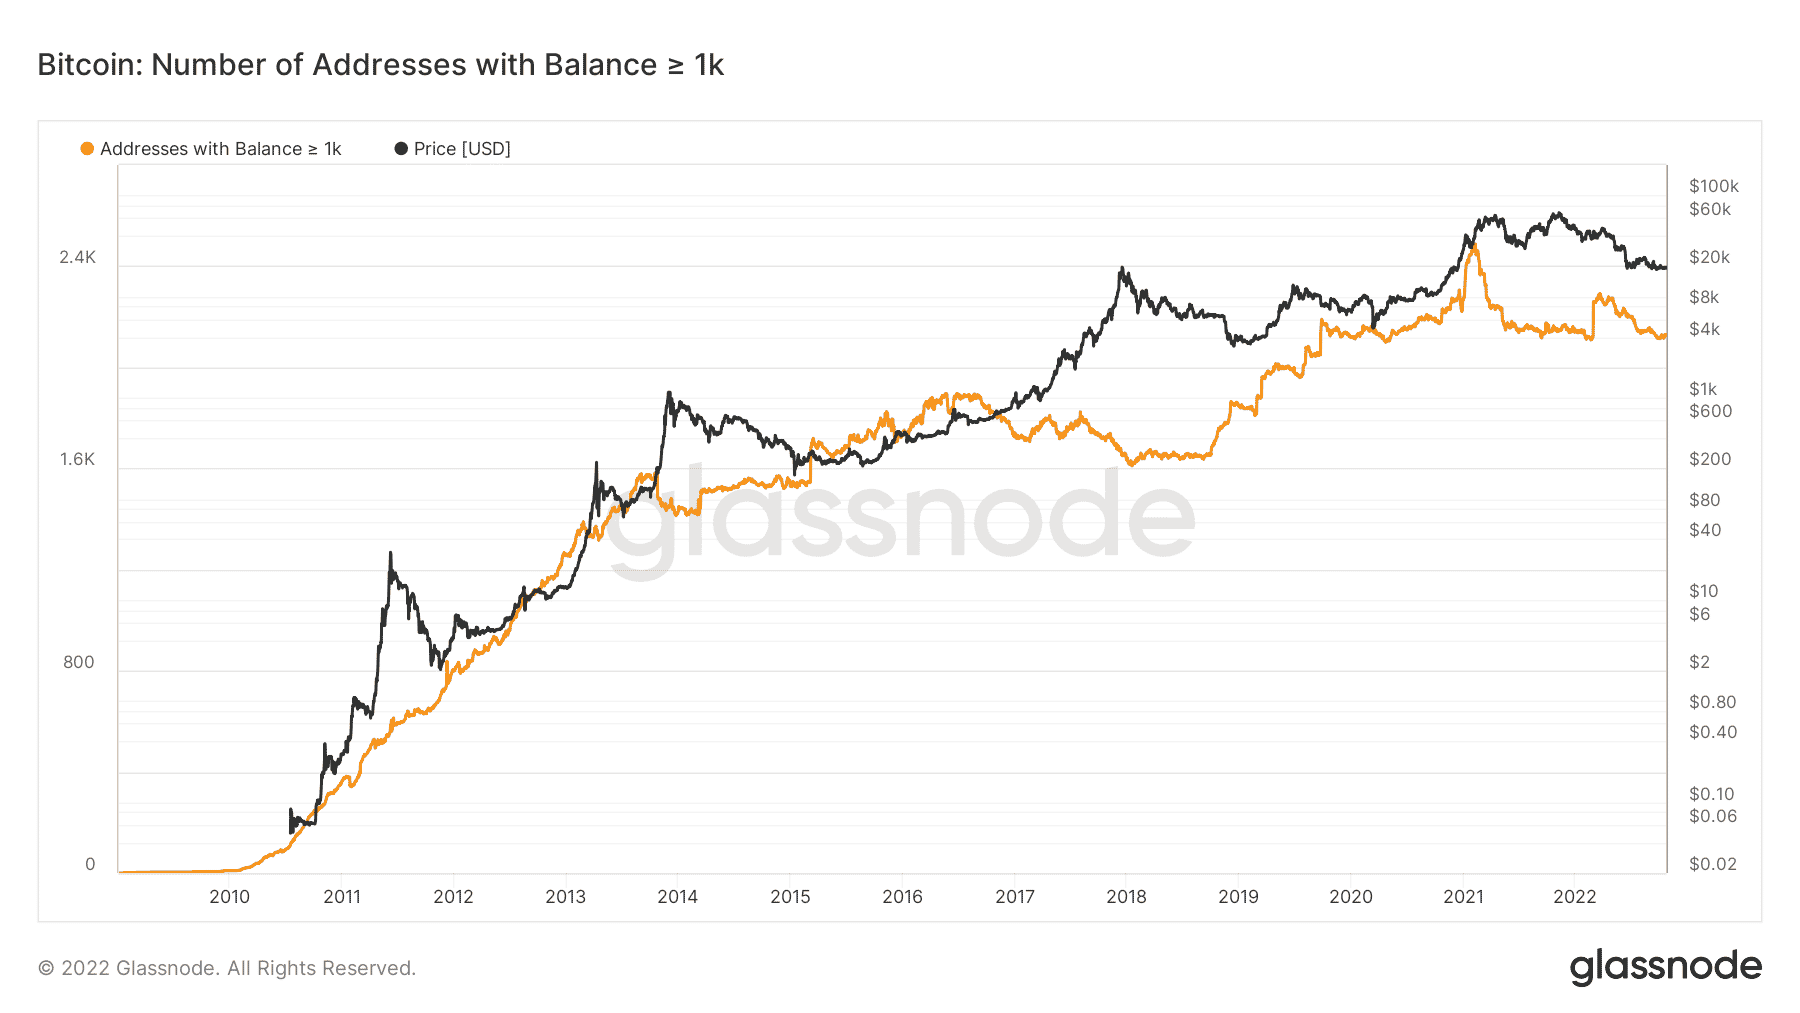
This was indicated by the distribution data, according to Glassnode. Based on the data available, addresses with 100 and 1000 BTCs, which had been decreasing since July, have not reversed to form an uptrend. At press time, addresses with more than 1000 BTC had fallen to 2,129.
Still off-form
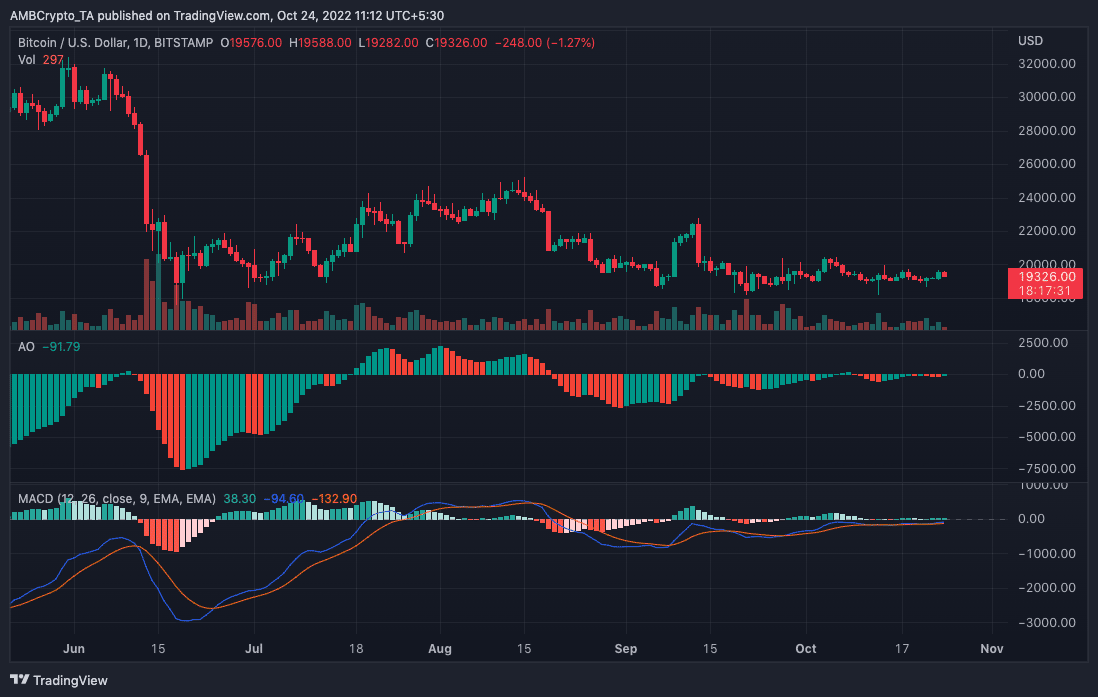
Additionally, the BTC/USD chart revealed that the coin is far from edging closer to bullish momentum. Indications from the Awesome Oscillator (AO) at -91.79 showed that BTC might struggle to gain positive momentum. Also, the Moving Average Convergence Divergence (MACD) revealed that the state of the coin was mostly bearish.
Although buyer strength (blue) and sellers momentum (orange) were struggling for relevance, the sellers seemed to be favoured more. However, with small gains revealed on the histogram, BTC’s potential to add more to its recent gains may not be off the cards.


